Compute gene activity scores, check known markers and annotate scATAC clusters
Perform differential peak accessibility analysis
ATAC-seq data may be obtained in isolation using a single-cell ATAC-seq protocol (e.g. 10X scATACseq) or in combination with gene expression data using a single-cell multiome protocole (e.g. 10X multiome and SHARE-seq).
Several packages are currently avaialble to process scATAC-seq data in R. These include Signac and ArchR. This lab will closely follow the processing steps outlined in Signac, which interfaces well with Seurat for single-cell analysis.
In this lab, we will process a PBMC single-cell ATAC-seq (scATAC-seq) dataset and perform preliminary analysis to assess quality of these data. The data for this lab comes from 10X Genomics. The dataset contains roughly ~ 10,000 cells.
13.1 Process human PBMC dataset
13.1.1 Download data
Data comes from 10X Genomics. Direct download links are provided below.
Download the files related to scATACseq of all human PBMC cells.
Notice how the count matrix is in a .h5 format. We have already encountered this format in Lab3. Back then, we imported it with DropletUtils::read10xCounts.
'SeuratObject' was built under R 4.4.0 but the current version is 4.4.1; it is recomended that you reinstall 'SeuratObject' as the ABI for R may have changed
'SeuratObject' was built with package 'Matrix' 1.7.0 but the current version is 1.7.1; it is recomended that you reinstall 'SeuratObject' as the ABI for 'Matrix' may have changed
Attaching package: 'SeuratObject'
The following objects are masked from 'package:base':

    intersect, t
The next step is to aggregate counts and features into a ChromatinAssay, a scATAC-seq flavour of Seurat standard Assays. The documentation for ?CreateChromatinAssay indicates that the user can provide:
A fragments file, corresponding to the full list of all unique fragments mapped across all single cells.
Genomic annotations to the ChromatinAssay, corresponding to gene annotations, promoter positions, etc. Such annotations can be generated from Ensembl.
Question
Generate human annotations from Ensembl using a parsing function from Seurat.
Answer
R
## - Get human gene annotations (hg19/GRCh37) to feed it into the future `ChromatinAssay`BiocManager::install('EnsDb.Hsapiens.v75')
'getOption("repos")' replaces Bioconductor standard repositories, see 'help("repositories", package = "BiocManager")' for details.
Replacement repositories:
    CRAN: https://cloud.r-project.org
Bioconductor version 3.19 (BiocManager 1.30.25), R 4.4.1 (2024-06-14)
Warning: package(s) not installed when version(s) same as or greater than current; use `force = TRUE` to re-install: 'EnsDb.Hsapiens.v75'
Warning in .merge_two_Seqinfo_objects(x, y): The 2 combined objects have no sequence levels in common. (Use
  suppressWarnings() to suppress this warning.)
Warning in .merge_two_Seqinfo_objects(x, y): The 2 combined objects have no sequence levels in common. (Use
  suppressWarnings() to suppress this warning.)
Warning in .merge_two_Seqinfo_objects(x, y): The 2 combined objects have no sequence levels in common. (Use
  suppressWarnings() to suppress this warning.)
Warning in .merge_two_Seqinfo_objects(x, y): The 2 combined objects have no sequence levels in common. (Use
  suppressWarnings() to suppress this warning.)
Warning in .merge_two_Seqinfo_objects(x, y): The 2 combined objects have no sequence levels in common. (Use
  suppressWarnings() to suppress this warning.)
Warning in .merge_two_Seqinfo_objects(x, y): The 2 combined objects have no sequence levels in common. (Use
  suppressWarnings() to suppress this warning.)
Warning in .merge_two_Seqinfo_objects(x, y): The 2 combined objects have no sequence levels in common. (Use
  suppressWarnings() to suppress this warning.)
Warning in .merge_two_Seqinfo_objects(x, y): The 2 combined objects have no sequence levels in common. (Use
  suppressWarnings() to suppress this warning.)
Warning in .merge_two_Seqinfo_objects(x, y): The 2 combined objects have no sequence levels in common. (Use
  suppressWarnings() to suppress this warning.)
Warning in .merge_two_Seqinfo_objects(x, y): The 2 combined objects have no sequence levels in common. (Use
  suppressWarnings() to suppress this warning.)
Warning in .merge_two_Seqinfo_objects(x, y): The 2 combined objects have no sequence levels in common. (Use
  suppressWarnings() to suppress this warning.)
Warning in .merge_two_Seqinfo_objects(x, y): The 2 combined objects have no sequence levels in common. (Use
  suppressWarnings() to suppress this warning.)
Warning in .merge_two_Seqinfo_objects(x, y): The 2 combined objects have no sequence levels in common. (Use
  suppressWarnings() to suppress this warning.)
Warning in .merge_two_Seqinfo_objects(x, y): The 2 combined objects have no sequence levels in common. (Use
  suppressWarnings() to suppress this warning.)
Warning in .merge_two_Seqinfo_objects(x, y): The 2 combined objects have no sequence levels in common. (Use
  suppressWarnings() to suppress this warning.)
Warning in .merge_two_Seqinfo_objects(x, y): The 2 combined objects have no sequence levels in common. (Use
  suppressWarnings() to suppress this warning.)
Warning in .merge_two_Seqinfo_objects(x, y): The 2 combined objects have no sequence levels in common. (Use
  suppressWarnings() to suppress this warning.)
Warning in .merge_two_Seqinfo_objects(x, y): The 2 combined objects have no sequence levels in common. (Use
  suppressWarnings() to suppress this warning.)
Warning in .merge_two_Seqinfo_objects(x, y): The 2 combined objects have no sequence levels in common. (Use
  suppressWarnings() to suppress this warning.)
Warning in .merge_two_Seqinfo_objects(x, y): The 2 combined objects have no sequence levels in common. (Use
  suppressWarnings() to suppress this warning.)
Warning in .merge_two_Seqinfo_objects(x, y): The 2 combined objects have no sequence levels in common. (Use
  suppressWarnings() to suppress this warning.)
Warning in .merge_two_Seqinfo_objects(x, y): The 2 combined objects have no sequence levels in common. (Use
  suppressWarnings() to suppress this warning.)
Warning in .merge_two_Seqinfo_objects(x, y): The 2 combined objects have no sequence levels in common. (Use
  suppressWarnings() to suppress this warning.)
Warning in .merge_two_Seqinfo_objects(x, y): The 2 combined objects have no sequence levels in common. (Use
  suppressWarnings() to suppress this warning.)
seqlevelsStyle(annotations)<-'UCSC'
Create a ChromatinAssay using counts, features, fragments and annotations.
ChromatinAssay data with 87561 features for 8728 cells
Variable features: 0
Genome: hg19
Annotation present: TRUE
Motifs present: FALSE
Fragment files: 1
What are the dimensions of this object? Are they comparable to the count matrix? Comment.
An object of class Seurat
87561 features across 8728 samples within 1 assay
Active assay: ATAC (87561 features, 0 variable features)
 2 layers present: counts, data
PBMC[['ATAC']]
ChromatinAssay data with 87561 features for 8728 cells
Variable features: 0
Genome: hg19
Annotation present: TRUE
Motifs present: FALSE
Fragment files: 1
Which analysis are the fragments required for, exactly?
Could we still perform normalization/clustering/annotation without them? And motif enrichment analysis?
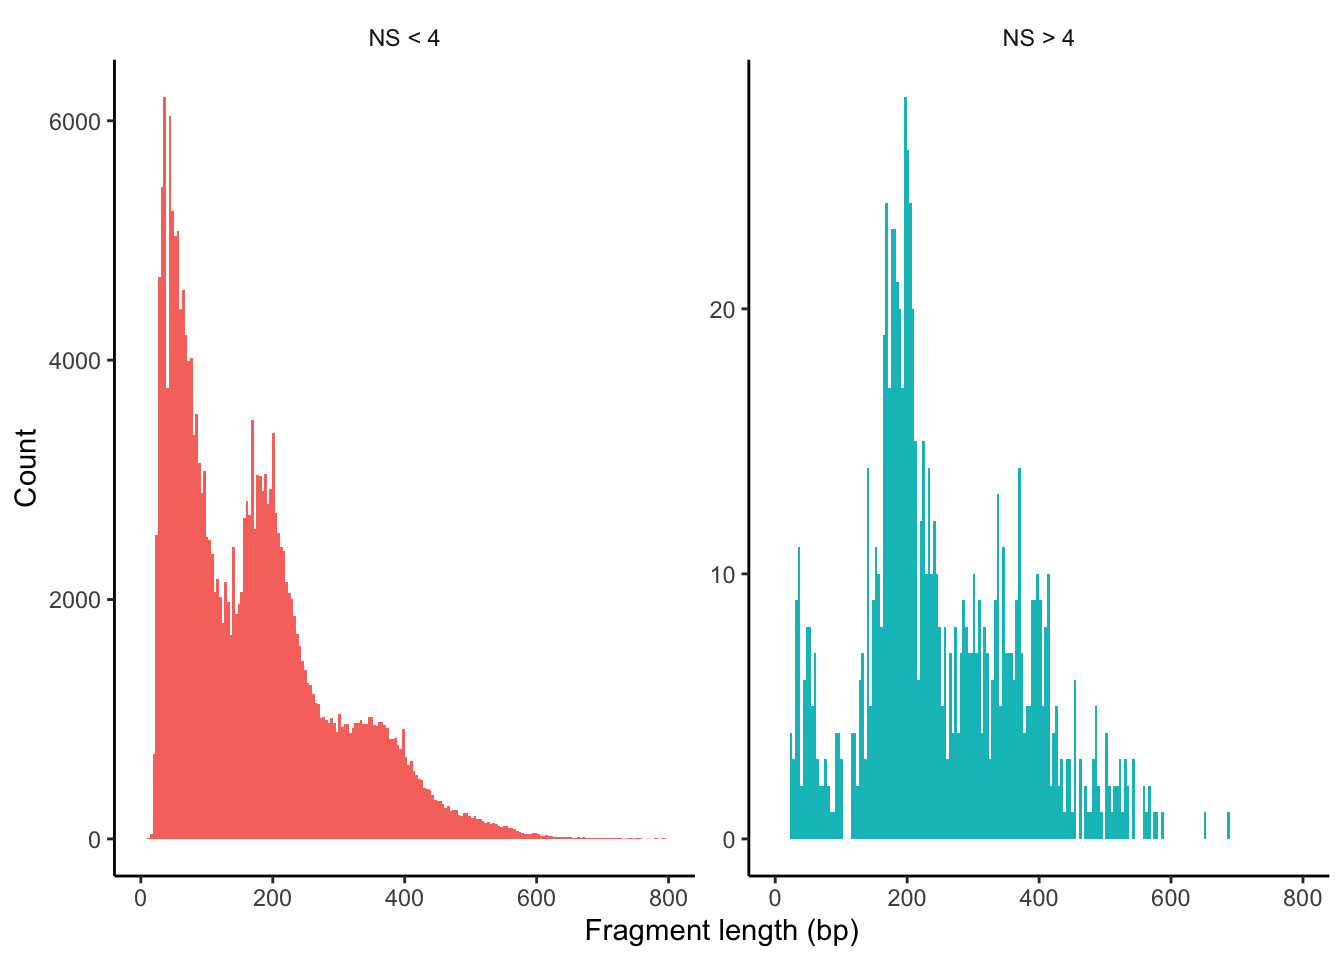
Since we do have the fragments file at hand, most of the QC steps are available (e.g. TSSEnrichment, NucleosomeSignal or fragment size distribution). Let’s go through them one by one.
Answer
R
# compute nucleosome signal score per cellPBMC<-NucleosomeSignal(object =PBMC)PBMC
An object of class Seurat
87561 features across 8728 samples within 1 assay
Active assay: ATAC (87561 features, 0 variable features)
 2 layers present: counts, data
# compute TSS enrichment score per cellPBMC<-Signac::TSSEnrichment(object =PBMC, fast =FALSE)
Extracting TSS positions
Finding + strand cut sites
Finding - strand cut sites
Computing mean insertion frequency in flanking regions
Normalizing TSS score
PBMC
An object of class Seurat
87561 features across 8728 samples within 1 assay
Active assay: ATAC (87561 features, 0 variable features)
 2 layers present: counts, data
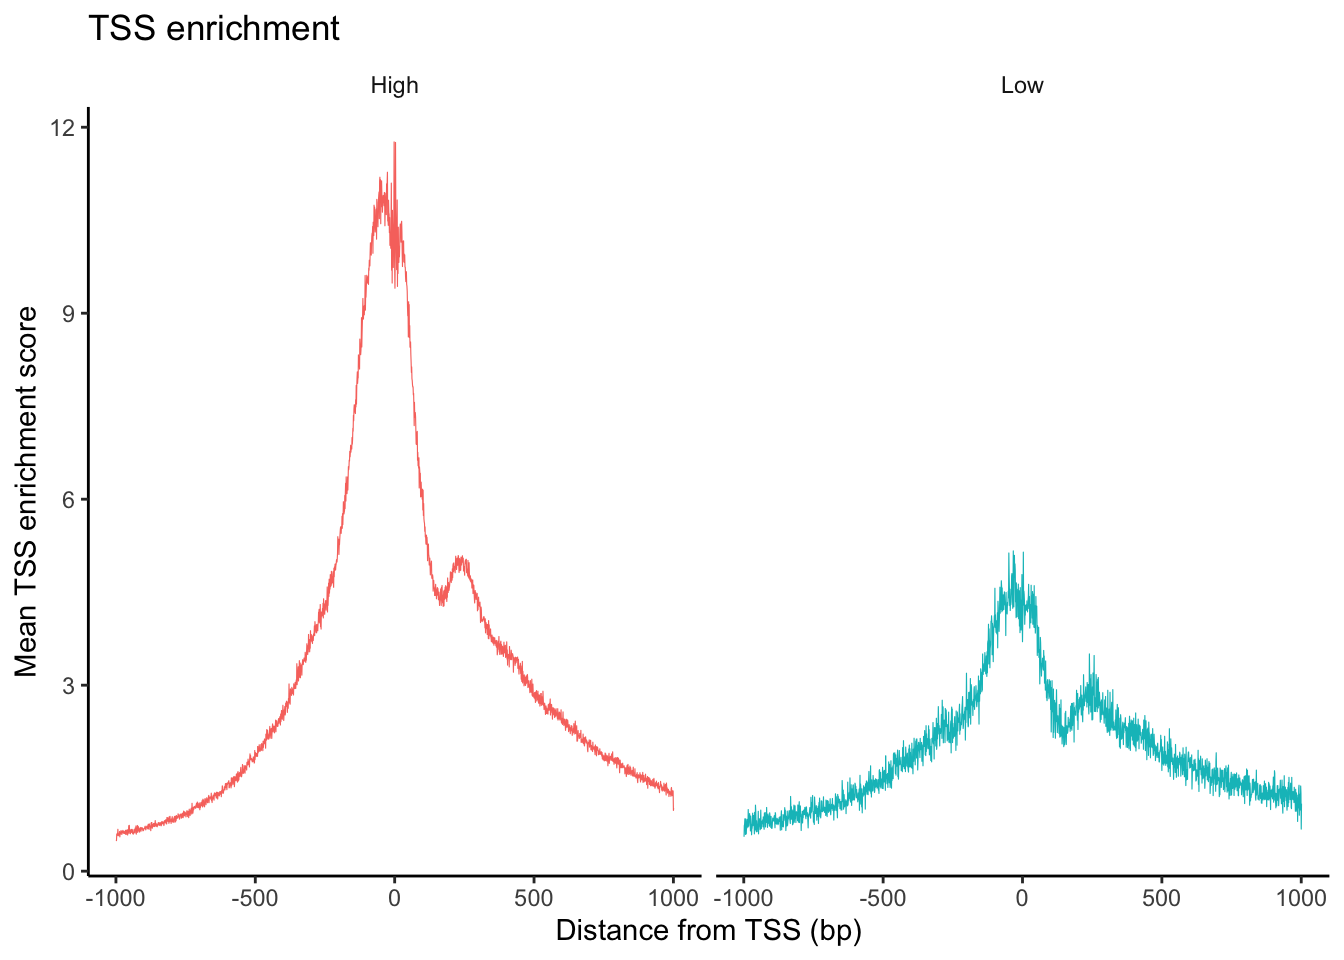
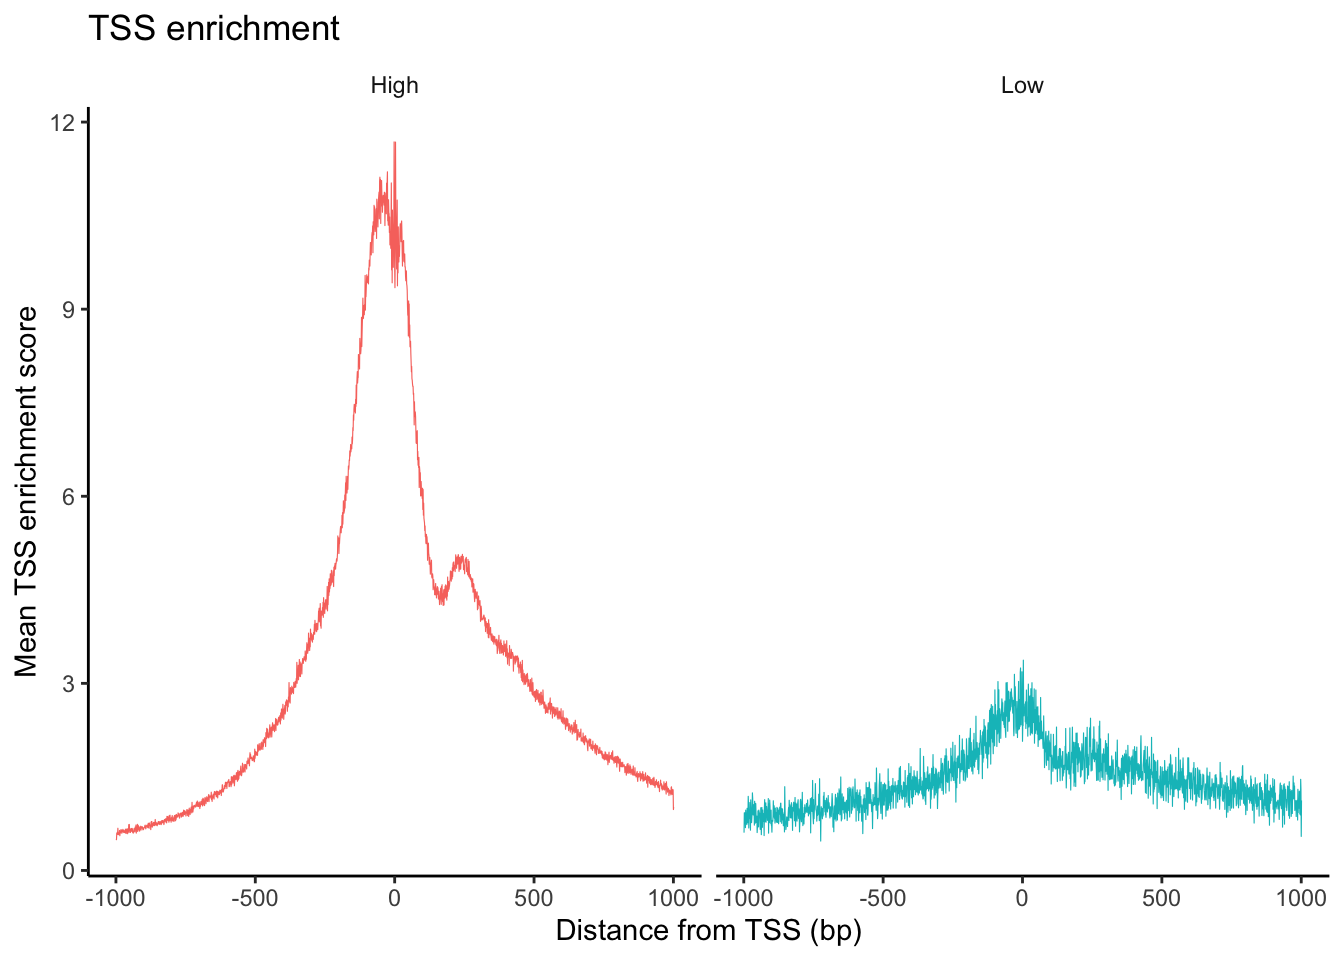
The TSSPlot function from Signac can be used to plot the fragment count per peak ~ TSS enrichment.
An object of class Seurat
87561 features across 8231 samples within 1 assay
Active assay: ATAC (87561 features, 0 variable features)
 2 layers present: counts, data
## - Remove peaks with low coveragePBMC<-PBMC[rowSums(GetAssayData(PBMC, layer ="counts"))>10, ]PBMC<-PBMC[rowSums(GetAssayData(PBMC, layer ="counts")>0)>10, ]PBMC
An object of class Seurat
87212 features across 8231 samples within 1 assay
Active assay: ATAC (87212 features, 0 variable features)
 2 layers present: counts, data
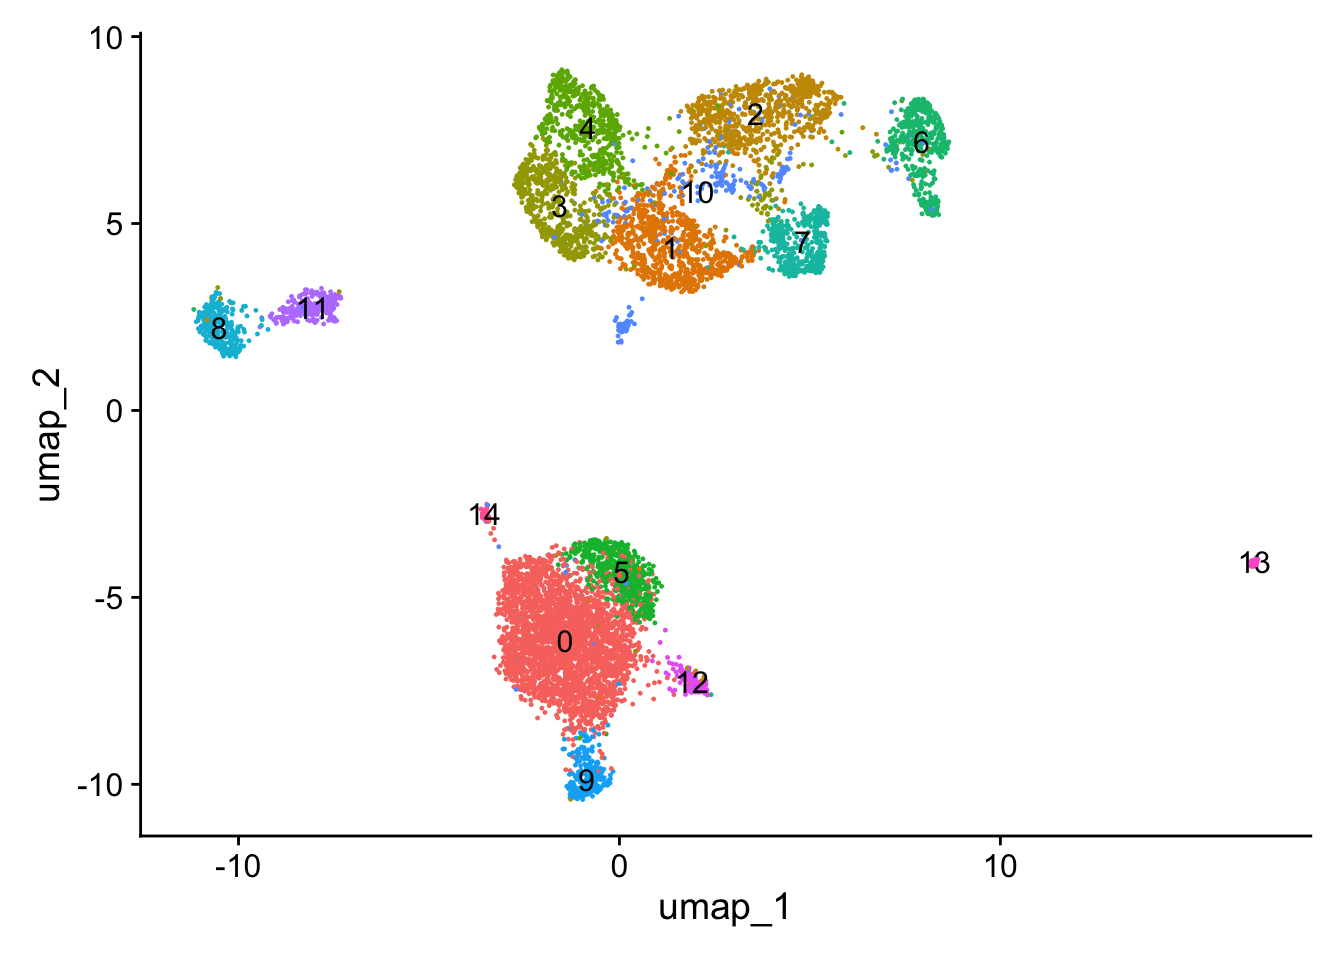
13.1.6 Dimensionality reduction and clustering
Now that the dataset is filtered, we can proceed to data normalization, dimensionality reduction and clustering. Compared to scRNAseq, scATACseq data is much sparser and has a higher dimensionality. This has important implications for the choice of normalization and dimensionality reduction methods. scATACseq data are generally normalized using a TF-IDF normalization, which is implemented in the RunTFIDF function in Signac, and dimensionality reduction is performed using LSI (Latent Semantic Indexing) implemented in the RunSVD function.
Question
Normalize then further reduce the dimensionality for visualization purposes.
Warning: The default method for RunUMAP has changed from calling Python UMAP via reticulate to the R-native UWOT using the cosine metric
To use Python UMAP via reticulate, set umap.method to 'umap-learn' and metric to 'correlation'
This message will be shown once per session
23:26:55 UMAP embedding parameters a = 0.9922 b = 1.112
23:26:55 Read 8231 rows and found 29 numeric columns
23:26:55 Using Annoy for neighbor search, n_neighbors = 30
23:26:55 Building Annoy index with metric = cosine, n_trees = 50
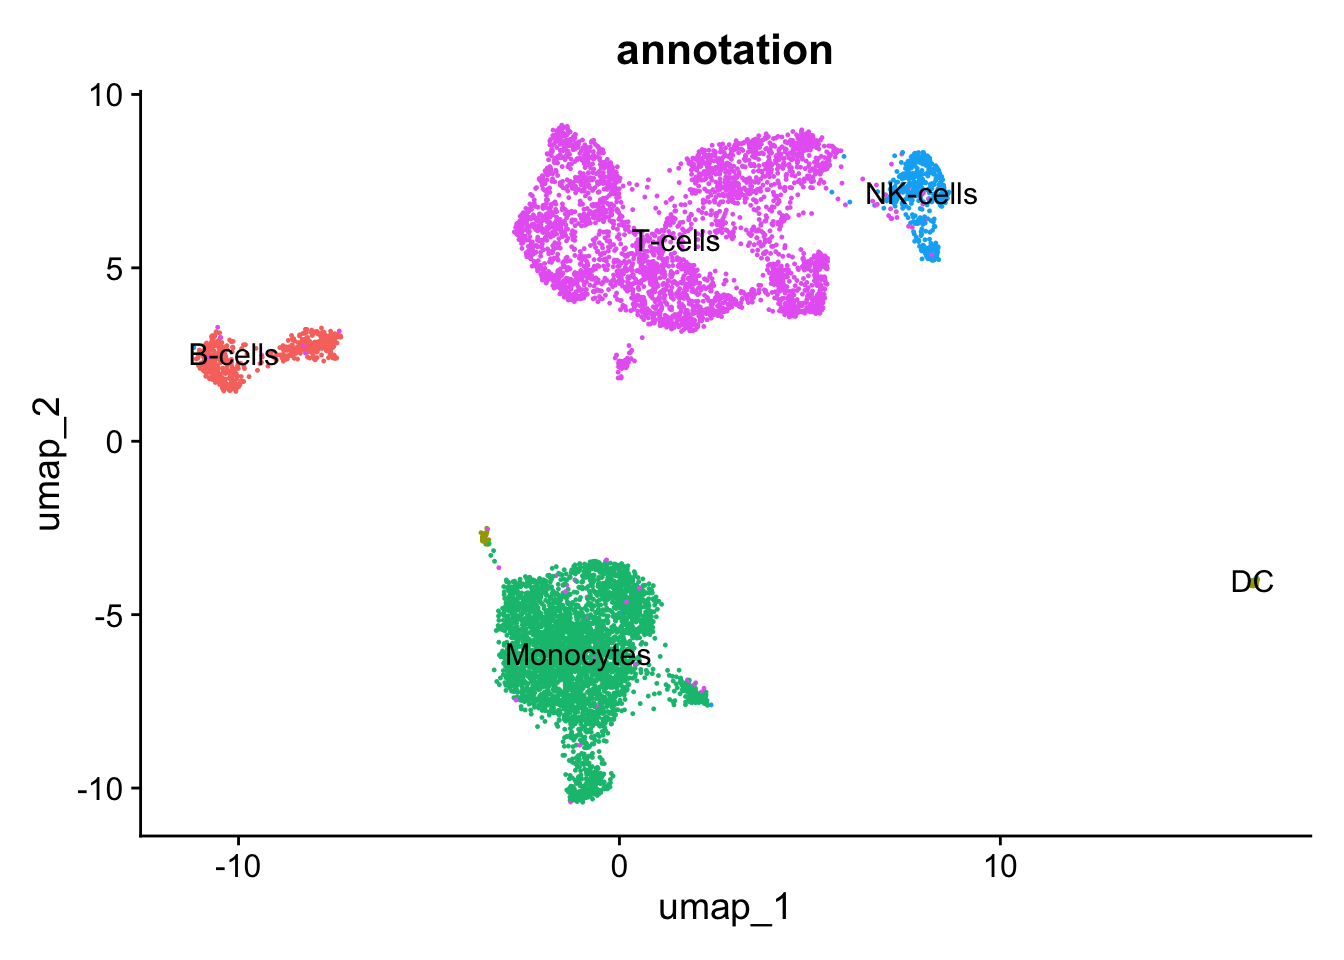
What can you observe in the UMAP projection of the dataset? Comment on the separation of some cell types into different spatially-resolved clusters.
13.2 Compute gene activity scores
Signac’s GeneActivity() function require scATACseq fragment information. Since we have them, we can estimate a gene activity score for each gene in the annotations.
Warning in SingleFeatureMatrix(fragment = fragments[[x]], features = features, : 13 features are on seqnames not present in the fragment file. These will be removed.
Extracting reads overlapping genomic regions
We can now save this new object as an Assay in the PBMC object and normalize it.
Warning: Non-unique features (rownames) present in the input matrix, making unique
# - Normalize the new RNA assay.PBMC<-NormalizeData(object =PBMC, assay ='RNA', normalization.method ='LogNormalize', scale.factor =median(PBMC$nCount_RNA))PBMC
An object of class Seurat
107222 features across 8231 samples within 2 assays
Active assay: ATAC (87212 features, 43610 variable features)
 2 layers present: counts, data
 1 other assay present: RNA
 2 dimensional reductions calculated: lsi, umap
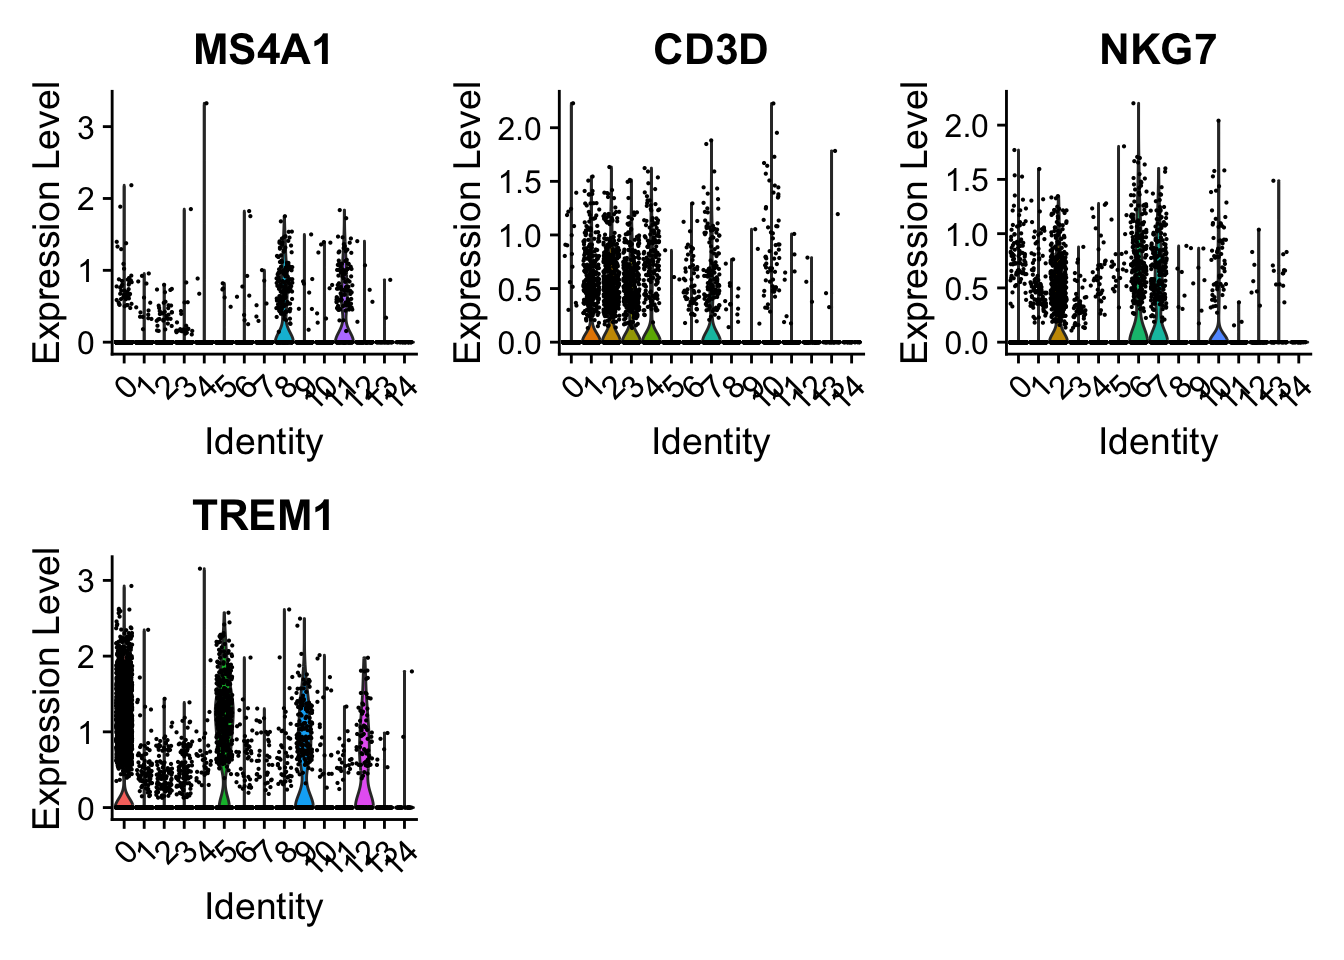
One can now visualize expression of individual markers across clusters to infer cluster identity.
Question
Assess the expression of known markers across clusters, projecting the cells in a 2D UMAP.
Answer
R
VlnPlot( object =PBMC, features =c('MS4A1', # B-cell'CD3D', # T-cell'NKG7', # NK cell'TREM1'# Monocytes), assay ="RNA")
13.3 Find peaks differentially accessible across clusters
Finally, we can perform differential peak accessibility analysis to identify peaks that are differentially accessible between clusters. This is done using the FindMarkers function in Signac, which is similar to FindAllMarkers in Seurat.