7  Lab 4 - Single-cell RNA-seq data wrangling

Notes

The estimated time for this lab is around 1h20.

Aims
  • Perform basic quality control on single-cell RNA-seq data
  • Filter cells and features in single-cell RNA-seq data
  • Compute and store new information in a SingleCellExperiment object
  • Check housekeeping genes and gene set expression in single-cell RNA-seq data
  • Plot embeddings of single-cell RNA-seq data

7.1 Introduction

Data produced in a single cell RNA-seq experiment has several interesting characteristics that make it distinct from data produced in a bulk population RNA-seq experiment.

Two characteristics that are important to keep in mind when working with scRNA-Seq are drop-out (the excessive amount of zeros due to limiting mRNA) and the potential for quality control (QC) metrics to be confounded with biology. This combined with the ability to measure heterogeniety from cells in samples has shifted the field away from the typical analysis in population-based RNA-Seq.

Here we demonstrate some approaches to quality control, followed by identifying and analyzing cell subsets.

7.1.1 Load necessary packages

When loading libraries, we are asking R to load code for us written by someone else. It is a convenient way to leverage and reproduce methodology developed by others.

Question

Following the previous labs, load the necessary libraries for this analysis.

── Attaching core tidyverse packages ──────────────────────────────────────────────────────────────────────────────────────────────────────────────────────────────────────────────── tidyverse 2.0.0 ──
✔ dplyr     1.1.4     ✔ readr     2.1.5
✔ forcats   1.0.0     ✔ stringr   1.5.1
✔ ggplot2   3.5.1     ✔ tibble    3.2.1
✔ lubridate 1.9.3     ✔ tidyr     1.3.1
✔ purrr     1.0.2     
── Conflicts ────────────────────────────────────────────────────────────────────────────────────────────────────────────────────────────────────────────────────────────────── tidyverse_conflicts() ──
✖ dplyr::filter() masks stats::filter()
✖ dplyr::lag()    masks stats::lag()
ℹ Use the conflicted package (<http://conflicted.r-lib.org/>) to force all conflicts to become errors
library(SingleCellExperiment)
Loading required package: SummarizedExperiment
Loading required package: MatrixGenerics
Loading required package: matrixStats

Attaching package: 'matrixStats'

The following object is masked from 'package:dplyr':

    count


Attaching package: 'MatrixGenerics'

The following objects are masked from 'package:matrixStats':

    colAlls, colAnyNAs, colAnys, colAvgsPerRowSet, colCollapse, colCounts, colCummaxs, colCummins, colCumprods, colCumsums, colDiffs, colIQRDiffs, colIQRs, colLogSumExps,
    colMadDiffs, colMads, colMaxs, colMeans2, colMedians, colMins, colOrderStats, colProds, colQuantiles, colRanges, colRanks, colSdDiffs, colSds, colSums2, colTabulates,
    colVarDiffs, colVars, colWeightedMads, colWeightedMeans, colWeightedMedians, colWeightedSds, colWeightedVars, rowAlls, rowAnyNAs, rowAnys, rowAvgsPerColSet, rowCollapse,
    rowCounts, rowCummaxs, rowCummins, rowCumprods, rowCumsums, rowDiffs, rowIQRDiffs, rowIQRs, rowLogSumExps, rowMadDiffs, rowMads, rowMaxs, rowMeans2, rowMedians, rowMins,
    rowOrderStats, rowProds, rowQuantiles, rowRanges, rowRanks, rowSdDiffs, rowSds, rowSums2, rowTabulates, rowVarDiffs, rowVars, rowWeightedMads, rowWeightedMeans,
    rowWeightedMedians, rowWeightedSds, rowWeightedVars

Loading required package: GenomicRanges
Loading required package: stats4
Loading required package: BiocGenerics

Attaching package: 'BiocGenerics'

The following objects are masked from 'package:lubridate':

    intersect, setdiff, union

The following objects are masked from 'package:dplyr':

    combine, intersect, setdiff, union

The following objects are masked from 'package:stats':

    IQR, mad, sd, var, xtabs

The following objects are masked from 'package:base':

    anyDuplicated, aperm, append, as.data.frame, basename, cbind, colnames, dirname, do.call, duplicated, eval, evalq, Filter, Find, get, grep, grepl, intersect, is.unsorted,
    lapply, Map, mapply, match, mget, order, paste, pmax, pmax.int, pmin, pmin.int, Position, rank, rbind, Reduce, rownames, sapply, setdiff, table, tapply, union, unique,
    unsplit, which.max, which.min

Loading required package: S4Vectors

Attaching package: 'S4Vectors'

The following objects are masked from 'package:lubridate':

    second, second<-

The following objects are masked from 'package:dplyr':

    first, rename

The following object is masked from 'package:tidyr':

    expand

The following object is masked from 'package:utils':

    findMatches

The following objects are masked from 'package:base':

    expand.grid, I, unname

Loading required package: IRanges

Attaching package: 'IRanges'

The following object is masked from 'package:lubridate':

    %within%

The following objects are masked from 'package:dplyr':

    collapse, desc, slice

The following object is masked from 'package:purrr':

    reduce

Loading required package: GenomeInfoDb
Loading required package: Biobase
Welcome to Bioconductor

    Vignettes contain introductory material; view with 'browseVignettes()'. To cite Bioconductor, see 'citation("Biobase")', and for packages 'citation("pkgname")'.


Attaching package: 'Biobase'

The following object is masked from 'package:MatrixGenerics':

    rowMedians

The following objects are masked from 'package:matrixStats':

    anyMissing, rowMedians

7.1.2 Create a SingleCellExperiment object from scratch

In the previous lab, we have been working with airway object (a SummarizedExperiment object) and sce, a SingleCellExperiment object. We will now create a toy SingleCellExperiment object from scratch, using the SingleCellExperiment constructor.

To create a SingleCellExperiment object, we need to provide the following:

  • colData: a data frame (or tibble) with columns corresponding to cell metadata.
  • rowData: a data frame (or tibble) with columns corresponding to gene metadata.
  • assays: a list of matrices, each matrix corresponding to a different assay. The first matrix is typically the counts matrix.
R
cd <- tibble(idx = paste0('cell', 1:100))  ## `cd` stands for colData
cd
# A tibble: 100 × 1
   idx   
   <chr> 
 1 cell1 
 2 cell2 
 3 cell3 
 4 cell4 
 5 cell5 
 6 cell6 
 7 cell7 
 8 cell8 
 9 cell9 
10 cell10
# ℹ 90 more rows
rd <- tibble(
    gene_name = paste0('gene', 1:10),
    gene_type = factor(rep(c('protein_coding', 'non_coding'), each = 5))
) ## `rd` stands for rowData
rd 
# A tibble: 10 × 2
   gene_name gene_type     
   <chr>     <fct>         
 1 gene1     protein_coding
 2 gene2     protein_coding
 3 gene3     protein_coding
 4 gene4     protein_coding
 5 gene5     protein_coding
 6 gene6     non_coding    
 7 gene7     non_coding    
 8 gene8     non_coding    
 9 gene9     non_coding    
10 gene10    non_coding    
cnts <- matrix(rpois(1000, 5), ncol = 100) ## `cnts` stands for counts

dim(cd)
[1] 100   1
dim(rd)
[1] 10  2
dim(cnts)
[1]  10 100
nrow(cd) == ncol(cnts)
[1] TRUE
nrow(rd) == nrow(cnts)
[1] TRUE
toy_sce <- SingleCellExperiment(
    colData = cd, 
    rowData = rd, 
    assays = list('counts' = cnts)
)
toy_sce
class: SingleCellExperiment 
dim: 10 100 
metadata(0):
assays(1): counts
rownames: NULL
rowData names(2): gene_name gene_type
colnames: NULL
colData names(1): idx
reducedDimNames(0):
mainExpName: NULL
altExpNames(0):
colData(toy_sce)
DataFrame with 100 rows and 1 column
            idx
    <character>
1         cell1
2         cell2
3         cell3
4         cell4
5         cell5
...         ...
96       cell96
97       cell97
98       cell98
99       cell99
100     cell100
rowData(toy_sce)
DataFrame with 10 rows and 2 columns
     gene_name      gene_type
   <character>       <factor>
1        gene1 protein_coding
2        gene2 protein_coding
3        gene3 protein_coding
4        gene4 protein_coding
5        gene5 protein_coding
6        gene6 non_coding    
7        gene7 non_coding    
8        gene8 non_coding    
9        gene9 non_coding    
10      gene10 non_coding    
assays(toy_sce)
List of length 1
names(1): counts
assays(toy_sce)[["counts"]][1:10, 1:10]
      [,1] [,2] [,3] [,4] [,5] [,6] [,7] [,8] [,9] [,10]
 [1,]   11    3    5    2    6    3    6    3   11     3
 [2,]    8    1    6    4    5    5    3    5    6     4
 [3,]    7    9    4    3    6    5    7    6    5     3
 [4,]    2    4    4    7    6    4    4    6    3     5
 [5,]    3    3    5    5    4    4    4    7    4     9
 [6,]    5    7    6    6    8    6    5    5    5     5
 [7,]    7    7    4    4    4    5    1    4    6     6
 [8,]    5    0    5    5    4    7    5    4    4     4
 [9,]    4    3    7    5    3    6    4    4    5     6
[10,]    5    3    2    4    5    2    4    4    2     2

7.1.3 Read in Pancreas counts matrix.

We will now analyze a real human pancreas scRNAseq dataset. It is freely available from GEO: link. We start by downloading the cell, features and counts matrix.

Question

Inspect the GEO page and get the downloadable links for each file

R
download.file('https://ftp.ncbi.nlm.nih.gov/geo/series/GSE114nnn/GSE114802/suppl/GSE114802_org4_barcodes.tsv.gz', 'GSE114802_org4_barcodes.tsv.gz')
download.file('https://ftp.ncbi.nlm.nih.gov/geo/series/GSE114nnn/GSE114802/suppl/GSE114802_org4_genes.tsv.gz', 'GSE114802_org4_genes.tsv.gz')
download.file('https://ftp.ncbi.nlm.nih.gov/geo/series/GSE114nnn/GSE114802/suppl/GSE114802_org4_counts.csv.gz', 'GSE114802_org4_counts.csv.gz')

In this dataset, the barcodes file contains the cell barcodes, the genes file contains the gene names, and the counts file contains the counts matrix. We can import the data into R using the read_tsv() and read_csv() functions (already available in the loaded tidyverse package).

For example, to read the barcodes file, we can use the following command:

R
cells <- read_tsv('~/Share/GSE114802_org4_barcodes.tsv.gz', col_names = FALSE)
Rows: 1421 Columns: 1
── Column specification ────────────────────────────────────────────────────────────────────────────────────────────────────────────────────────────────────────────────────────────────────────────────
Delimiter: "\t"
chr (1): X1

ℹ Use `spec()` to retrieve the full column specification for this data.
ℹ Specify the column types or set `show_col_types = FALSE` to quiet this message.
head(cells)
# A tibble: 6 × 1
  X1                
  <chr>             
1 AAACCTGAGGCTCATT-1
2 AAACCTGAGGTGCACA-1
3 AAACCTGCAGGTGCCT-1
4 AAACCTGGTTAGAACA-1
5 AAACCTGTCACCACCT-1
6 AAACCTGTCCGAGCCA-1
Question

Also read the genes and counts files into R.

R
genes <- read_tsv('~/Share/GSE114802_org4_genes.tsv.gz', col_names = FALSE)
Rows: 33694 Columns: 2
── Column specification ────────────────────────────────────────────────────────────────────────────────────────────────────────────────────────────────────────────────────────────────────────────────
Delimiter: "\t"
chr (2): X1, X2

ℹ Use `spec()` to retrieve the full column specification for this data.
ℹ Specify the column types or set `show_col_types = FALSE` to quiet this message.
genes
# A tibble: 33,694 × 2
   X1              X2           
   <chr>           <chr>        
 1 ENSG00000243485 RP11-34P13.3 
 2 ENSG00000237613 FAM138A      
 3 ENSG00000186092 OR4F5        
 4 ENSG00000238009 RP11-34P13.7 
 5 ENSG00000239945 RP11-34P13.8 
 6 ENSG00000239906 RP11-34P13.14
 7 ENSG00000241599 RP11-34P13.9 
 8 ENSG00000279928 FO538757.3   
 9 ENSG00000279457 FO538757.2   
10 ENSG00000228463 AP006222.2   
# ℹ 33,684 more rows
counts <- read_csv('~/Share/GSE114802_org4_counts.csv.gz', col_names = TRUE)
New names:
Rows: 33694 Columns: 1422
── Column specification
──────────────────────────────────────────────────────────────────────────────────────────────────────────────────────────────────────────────────────────────────────────────── Delimiter: "," chr
(1): ...1 dbl (1421): AAACCTGAGGCTCATT-1, AAACCTGAGGTGCACA-1, AAACCTGCAGGTGCCT-1, AAACCTGGTTAGAACA-1, AAACCTGTCACCACCT-1, AAACCTGTCCGAGCCA-1, AAACCTGTCGTGACAT-1, AAACGGGAGTAGTGCG-1,
AAACGGGCAGCGTTCG-1, AAAC...
ℹ Use `spec()` to retrieve the full column specification for this data. ℹ Specify the column types or set `show_col_types = FALSE` to quiet this message.
• `` -> `...1`
counts[1:10, 1:6]
# A tibble: 10 × 6
   ...1            `AAACCTGAGGCTCATT-1` `AAACCTGAGGTGCACA-1` `AAACCTGCAGGTGCCT-1` `AAACCTGGTTAGAACA-1` `AAACCTGTCACCACCT-1`
   <chr>                          <dbl>                <dbl>                <dbl>                <dbl>                <dbl>
 1 ENSG00000243485                    0                    0                    0                    0                    0
 2 ENSG00000237613                    0                    0                    0                    0                    0
 3 ENSG00000186092                    0                    0                    0                    0                    0
 4 ENSG00000238009                    0                    0                    0                    0                    0
 5 ENSG00000239945                    0                    0                    0                    0                    0
 6 ENSG00000239906                    0                    0                    0                    0                    0
 7 ENSG00000241599                    0                    0                    0                    0                    0
 8 ENSG00000279928                    0                    0                    0                    0                    0
 9 ENSG00000279457                    0                    0                    0                    0                    0
10 ENSG00000228463                    0                    0                    3                    2                    0

Note how the first column of the counts dataframe is the gene names. We will need to strip this column, and turn the data frame into a matrix.

R
counts <- counts[, -1]
counts <- as(counts, 'matrix')
counts[1:10, 1:6]
      AAACCTGAGGCTCATT-1 AAACCTGAGGTGCACA-1 AAACCTGCAGGTGCCT-1 AAACCTGGTTAGAACA-1 AAACCTGTCACCACCT-1 AAACCTGTCCGAGCCA-1
 [1,]                  0                  0                  0                  0                  0                  0
 [2,]                  0                  0                  0                  0                  0                  0
 [3,]                  0                  0                  0                  0                  0                  0
 [4,]                  0                  0                  0                  0                  0                  0
 [5,]                  0                  0                  0                  0                  0                  0
 [6,]                  0                  0                  0                  0                  0                  0
 [7,]                  0                  0                  0                  0                  0                  0
 [8,]                  0                  0                  0                  0                  0                  0
 [9,]                  0                  0                  0                  0                  0                  0
[10,]                  0                  0                  3                  2                  0                  0
Question

Coerce the data into a SingleCellExperiment object.

R
sce <- SingleCellExperiment(
    colData = cells, 
    rowData = genes, 
    assays = list('counts' = counts)
)
Question

Examine the SingleCellExperiment object you’ve just created. Get an idea of the size of the dataset, the different data available, etc.

R
colData(sce)
DataFrame with 1421 rows and 1 column
                                   X1
                          <character>
AAACCTGAGGCTCATT-1 AAACCTGAGGCTCATT-1
AAACCTGAGGTGCACA-1 AAACCTGAGGTGCACA-1
AAACCTGCAGGTGCCT-1 AAACCTGCAGGTGCCT-1
AAACCTGGTTAGAACA-1 AAACCTGGTTAGAACA-1
AAACCTGTCACCACCT-1 AAACCTGTCACCACCT-1
...                               ...
TTTGGTTTCGGTGTCG-1 TTTGGTTTCGGTGTCG-1
TTTGTCAAGGATGGAA-1 TTTGTCAAGGATGGAA-1
TTTGTCAGTACCTACA-1 TTTGTCAGTACCTACA-1
TTTGTCAGTCTCACCT-1 TTTGTCAGTCTCACCT-1
TTTGTCAGTGAAATCA-1 TTTGTCAGTGAAATCA-1
rowData(sce)
DataFrame with 33694 rows and 2 columns
                   X1           X2
          <character>  <character>
1     ENSG00000243485 RP11-34P13.3
2     ENSG00000237613      FAM138A
3     ENSG00000186092        OR4F5
4     ENSG00000238009 RP11-34P13.7
5     ENSG00000239945 RP11-34P13.8
...               ...          ...
33690 ENSG00000277856   AC233755.2
33691 ENSG00000275063   AC233755.1
33692 ENSG00000271254   AC240274.1
33693 ENSG00000277475   AC213203.1
33694 ENSG00000268674      FAM231B
metadata(sce)
dim(sce)
[1] 33694  1421
assays(sce)
List of length 1
names(1): counts
counts(sce)[1:10, 1:10]
      AAACCTGAGGCTCATT-1 AAACCTGAGGTGCACA-1 AAACCTGCAGGTGCCT-1 AAACCTGGTTAGAACA-1 AAACCTGTCACCACCT-1 AAACCTGTCCGAGCCA-1 AAACCTGTCGTGACAT-1 AAACGGGAGTAGTGCG-1 AAACGGGCAGCGTTCG-1 AAACGGGCATGTTCCC-1
 [1,]                  0                  0                  0                  0                  0                  0                  0                  0                  0                  0
 [2,]                  0                  0                  0                  0                  0                  0                  0                  0                  0                  0
 [3,]                  0                  0                  0                  0                  0                  0                  0                  0                  0                  0
 [4,]                  0                  0                  0                  0                  0                  0                  0                  0                  0                  0
 [5,]                  0                  0                  0                  0                  0                  0                  0                  0                  0                  0
 [6,]                  0                  0                  0                  0                  0                  0                  0                  0                  0                  0
 [7,]                  0                  0                  0                  0                  0                  0                  0                  0                  0                  0
 [8,]                  0                  0                  0                  0                  0                  0                  0                  0                  0                  0
 [9,]                  0                  0                  0                  0                  0                  0                  0                  0                  0                  0
[10,]                  0                  0                  3                  2                  0                  0                  0                  0                  1                  0
List of length 0
names(0): 

7.2 Basic QCs

You can learn a lot about your scRNA-seq data’s quality with simple plotting.
Let’s do some plotting to look at the number of reads per cell, reads per genes, expressed genes per cell (often called complexity), and rarity of genes (cells expressing genes).

Question

Plot the number of counts per cell, the number of expressed genes per cell, and the relationship between the two.

R
counts_per_cell <- Matrix::colSums(counts)
counts_per_gene <- Matrix::rowSums(counts)
genes_per_cell <- Matrix::colSums(counts > 0) # count gene only if it has non-zero reads mapped.
hist(log10(counts_per_cell+1), main = '# of counts per cell', col = 'wheat')

hist(log10(genes_per_cell+1), main = '# of expressed genes per cell', col = 'wheat')

plot(counts_per_cell, genes_per_cell, log = 'xy', col = 'wheat')
title('Counts vs genes per cell')

Question

Look at the summary counts for genes and cells. Can you plot a histogram of counts per gene in log10 scale?

R
cells_per_gene <- Matrix::rowSums(counts > 0) # only count cells where the gene is expressed
hist(log10(cells_per_gene+1), main = '# of cells expressing each gene', col = 'wheat')

A very useful plot is the distribution of library complexity in the sequencing run, typically shown as a lineplot of the number of detected UMI per cell, with cells ranked in decreasing order. One can use such plot to investigate observations (potential cells) that are actually failed libraries (lower end outliers) or observations that are cell doublets (higher end outliers).

Question

Plot cells ranked by their number of detected genes. Comment.

R
plot(
    sort(genes_per_cell, decreasing = TRUE), 
    xlab = 'cell', log = 'y', main = '# of genes per cell (ordered)', 
    type = 'l'
)

Several QCs can be automatically computed using quickPerCellQC().

R
toy_sce <- scuttle::quickPerCellQC(toy_sce)
colData(toy_sce)
DataFrame with 91 rows and 7 columns
            idx       sum  detected     total     low_lib_size   low_n_features   discard
    <character> <numeric> <numeric> <numeric> <outlier.filter> <outlier.filter> <logical>
1         cell1        57        10        57            FALSE            FALSE     FALSE
2         cell3        48        10        48            FALSE            FALSE     FALSE
3         cell4        45        10        45            FALSE            FALSE     FALSE
4         cell5        51        10        51            FALSE            FALSE     FALSE
5         cell6        47        10        47            FALSE            FALSE     FALSE
...         ...       ...       ...       ...              ...              ...       ...
87       cell94        45        10        45            FALSE            FALSE     FALSE
88       cell95        44        10        44            FALSE            FALSE     FALSE
89       cell96        46        10        46            FALSE            FALSE     FALSE
90       cell97        57        10        57            FALSE            FALSE     FALSE
91       cell99        41        10        41            FALSE            FALSE     FALSE
table(toy_sce$low_lib_size)

FALSE 
   91 
table(toy_sce$low_n_features)

FALSE 
   91 
Question

Run quickPerCellQC() on the SingleCellExperiment object. Inspect the new colData of the object.

R
sce <- scuttle::quickPerCellQC(sce)
colData(sce)
DataFrame with 1420 rows and 7 columns
                                   X1       sum  detected     total     low_lib_size   low_n_features   discard
                          <character> <numeric> <numeric> <numeric> <outlier.filter> <outlier.filter> <logical>
AAACCTGAGGCTCATT-1 AAACCTGAGGCTCATT-1     18836      4512     18836            FALSE            FALSE     FALSE
AAACCTGAGGTGCACA-1 AAACCTGAGGTGCACA-1     22583      3915     22583            FALSE            FALSE     FALSE
AAACCTGCAGGTGCCT-1 AAACCTGCAGGTGCCT-1     34931      6449     34931            FALSE            FALSE     FALSE
AAACCTGGTTAGAACA-1 AAACCTGGTTAGAACA-1     14382      3910     14382            FALSE            FALSE     FALSE
AAACCTGTCACCACCT-1 AAACCTGTCACCACCT-1     19542      4469     19542            FALSE            FALSE     FALSE
...                               ...       ...       ...       ...              ...              ...       ...
TTTGGTTTCGGTGTCG-1 TTTGGTTTCGGTGTCG-1    139350     10354    139350            FALSE            FALSE     FALSE
TTTGTCAAGGATGGAA-1 TTTGTCAAGGATGGAA-1     10629      2382     10629            FALSE            FALSE     FALSE
TTTGTCAGTACCTACA-1 TTTGTCAGTACCTACA-1     11836      3140     11836            FALSE            FALSE     FALSE
TTTGTCAGTCTCACCT-1 TTTGTCAGTCTCACCT-1     19054      3316     19054            FALSE            FALSE     FALSE
TTTGTCAGTGAAATCA-1 TTTGTCAGTGAAATCA-1     12646      3268     12646            FALSE            FALSE     FALSE

7.3 Access to stored informations

7.3.1 Assay slots

For typical scRNA-seq experiments, a SingleCellExperiment can have multiple assays, corresponding to different metrics. The most basic one is counts.
Different assays store different ‘transformations’ of the counts(e.g. `logcounts).

For example, one can compute mean-centered counts and store it in a new slot.

R
mean_centered_counts <- scale(counts(toy_sce), center = TRUE, scale = FALSE)
assay(toy_sce, 'mean_centered') <- mean_centered_counts
assays(toy_sce)
List of length 2
names(2): counts mean_centered
assay(toy_sce, 'mean_centered')[1:10, 1:10]
      [,1] [,2] [,3] [,4] [,5] [,6] [,7] [,8] [,9] [,10]
 [1,]  5.3  0.2 -2.5  0.9 -1.7  1.7 -1.8  5.9 -1.7   2.9
 [2,]  2.3  1.2 -0.5 -0.1  0.3 -1.3  0.2  0.9 -0.7  -1.1
 [3,]  1.3 -0.8 -1.5  0.9  0.3  2.7  1.2 -0.1 -1.7  -0.1
 [4,] -3.7 -0.8  2.5  0.9 -0.7 -0.3  1.2 -2.1  0.3   2.9
 [5,] -2.7  0.2  0.5 -1.1 -0.7 -0.3  2.2 -1.1  4.3  -1.1
 [6,] -0.7  1.2  1.5  2.9  1.3  0.7  0.2 -0.1  0.3   1.9
 [7,]  1.3 -0.8 -0.5 -1.1  0.3 -3.3 -0.8  0.9  1.3  -3.1
 [8,] -0.7  0.2  0.5 -1.1  2.3  0.7 -0.8 -1.1 -0.7   1.9
 [9,] -1.7  2.2  0.5 -2.1  1.3 -0.3 -0.8 -0.1  1.3  -1.1
[10,] -0.7 -2.8 -0.5 -0.1 -2.7 -0.3 -0.8 -3.1 -2.7  -3.1
mean(assay(toy_sce, 'mean_centered'))
[1] 1.1712e-17
Question

Try to manually compute logcounts from counts and store it in a new slot.

R
assay(sce, 'logcounts') <- log10(counts(sce) + 1)
logcounts(sce)[1:10, 1:10]
      AAACCTGAGGCTCATT-1 AAACCTGAGGTGCACA-1 AAACCTGCAGGTGCCT-1 AAACCTGGTTAGAACA-1 AAACCTGTCACCACCT-1 AAACCTGTCCGAGCCA-1 AAACCTGTCGTGACAT-1 AAACGGGAGTAGTGCG-1 AAACGGGCAGCGTTCG-1 AAACGGGCATGTTCCC-1
 [1,]                  0                  0            0.00000            0.00000                  0                  0                  0                  0            0.00000                  0
 [2,]                  0                  0            0.00000            0.00000                  0                  0                  0                  0            0.00000                  0
 [3,]                  0                  0            0.00000            0.00000                  0                  0                  0                  0            0.00000                  0
 [4,]                  0                  0            0.00000            0.00000                  0                  0                  0                  0            0.00000                  0
 [5,]                  0                  0            0.00000            0.00000                  0                  0                  0                  0            0.00000                  0
 [6,]                  0                  0            0.00000            0.00000                  0                  0                  0                  0            0.00000                  0
 [7,]                  0                  0            0.00000            0.00000                  0                  0                  0                  0            0.00000                  0
 [8,]                  0                  0            0.00000            0.00000                  0                  0                  0                  0            0.00000                  0
 [9,]                  0                  0            0.00000            0.00000                  0                  0                  0                  0            0.00000                  0
[10,]                  0                  0            0.60206            0.47712                  0                  0                  0                  0            0.30103                  0

7.3.2 Embeddings

Embeddings allow for a representation of large-scale data (N cells x M genes) into smaller dimensions (e.g. 2-50 dimensions). Typical embeddings can be PCA, t-SNE, UMAP, etc… Many embeddings can be computed using run...() functions from Bioconductor packages (e.g. scran, scater, …).

For example, one can compute PCA and store it in a new slot.

Loading required package: scuttle
logcounts(toy_sce) <- log10(counts(toy_sce) + 1)
toy_sce <- scater::runPCA(toy_sce)
Warning in check_numbers(k = k, nu = nu, nv = nv, limit = min(dim(x)) - : more singular values/vectors requested than available
Warning in (function (A, nv = 5, nu = nv, maxit = 1000, work = nv + 7, reorth = TRUE, : You're computing too large a percentage of total singular values, use a standard svd instead.
Warning in (function (A, nv = 5, nu = nv, maxit = 1000, work = nv + 7, reorth = TRUE, : did not converge--results might be invalid!; try increasing work or maxit
reducedDims(toy_sce)
List of length 1
names(1): PCA
reducedDim(toy_sce, 'PCA')[1:10, ]
             PC1        PC2       PC3       PC4        PC5       PC6        PC7       PC8        PC9
 [1,] -0.4269241  0.2770703  0.040464  0.011101 -0.0905776 -0.139943  0.0052699  0.061907  0.0949146
 [2,] -0.0752433 -0.1804089 -0.040888  0.221613  0.0017994 -0.070413  0.0074647  0.094725  0.0879006
 [3,]  0.1896939 -0.2637306  0.047464 -0.059461 -0.0294352  0.125050 -0.0538721  0.081399 -0.0419140
 [4,] -0.0052209  0.0461005 -0.143536 -0.142892 -0.1844590 -0.094570 -0.0690900 -0.014200  0.0205512
 [5,] -0.0369835 -0.1788274 -0.022743  0.101437  0.0400642 -0.027818  0.0733583  0.282297 -0.0056744
 [6,]  0.2805255  0.1934287 -0.157491  0.141569 -0.0850000 -0.115990  0.0619579  0.011684 -0.0102393
 [7,]  0.1219353 -0.0688337 -0.091505 -0.104105  0.0811481  0.057121  0.0157687  0.013568  0.1065238
 [8,] -0.3673286 -0.0019512 -0.119952  0.181115  0.0039182 -0.166871  0.0242721 -0.030501  0.0308548
 [9,] -0.0100844 -0.3204644 -0.060936  0.098437  0.2401735  0.090652 -0.0963534  0.011799  0.0153486
[10,]  0.1970275 -0.1038143 -0.390062  0.317542 -0.2324288 -0.098581  0.1797298 -0.016561 -0.2208396
plotReducedDim(toy_sce, 'PCA')

Question

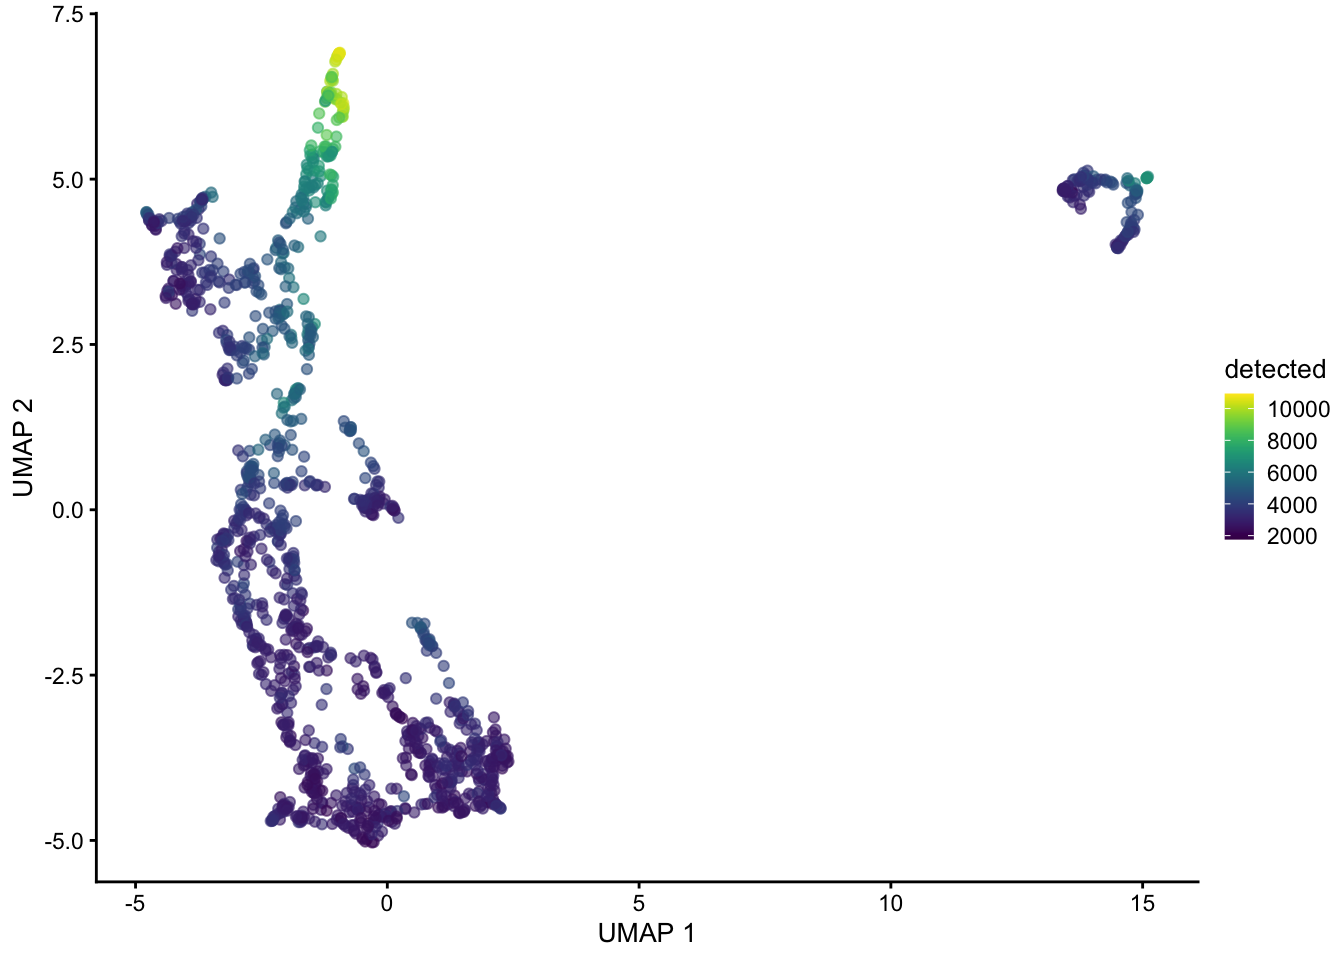
Try to compute PCA, t-SNE and UMAP embeddings of the pancreas dataset using runPCA(), runTSNE() and runUMAP() from scater package.

R
sce <- scater::runPCA(sce)
plotReducedDim(sce, "PCA")

sce <- scater::runTSNE(sce)
plotReducedDim(sce, "TSNE")

sce <- scater::runUMAP(sce)
plotReducedDim(sce, "UMAP", colour_by = 'sum')

plotReducedDim(sce, "UMAP", colour_by = 'detected')

7.4 Filtering cells and features

7.4.1 Pre-filtering

Filtering operations are often performed on the SingleCellExperiment object, for example to remove low-quality cells (columns) or genes (rows).

To do this, one can use standard R syntax to subset the SingleCellExperiment object.

R
toy_sce_filtered <- toy_sce[rowData(toy_sce)$gene_type == 'protein_coding', toy_sce$sum > 50]
Question

Filter the SCE to only include cells that have a complexity of 2000 genes or more and genes that are are expressed in 10 or more cells.

R
sce_filtered <- sce[
    Matrix::rowSums(counts(sce) > 0) > 10, 
    Matrix::colSums(counts(sce) > 0) > 2000
]
sce_filtered
class: SingleCellExperiment 
dim: 16606 1419 
metadata(0):
assays(2): counts logcounts
rownames: NULL
rowData names(2): X1 X2
colnames(1419): AAACCTGAGGCTCATT-1 AAACCTGAGGTGCACA-1 ... TTTGTCAGTCTCACCT-1 TTTGTCAGTGAAATCA-1
colData names(7): X1 sum ... low_n_features discard
reducedDimNames(3): PCA TSNE UMAP
mainExpName: NULL
altExpNames(1): ATAC_counts

Almost all our analysis will be on this single object, of class SingleCellExperiment. This object contains various “slots” that will store not only the raw count data, but also the results from various computations below. This has the advantage that we do not need to keep track of inidividual variables of interest - they can all be collapsed into a single object as long as these slots are pre-defined.

7.4.2 Filtering low-quality cells: mitochondrial counts

For each cell, we can calculate the percentage of counts mapping on mitochondrial genes and store it in a column percent_mito in our colData().

R
rowData(sce_filtered)
DataFrame with 16606 rows and 2 columns
                   X1            X2
          <character>   <character>
1     ENSG00000279457    FO538757.2
2     ENSG00000228463    AP006222.2
3     ENSG00000237094 RP4-669L17.10
4     ENSG00000237491 RP11-206L10.9
5     ENSG00000225880     LINC00115
...               ...           ...
16602 ENSG00000198727        MT-CYB
16603 ENSG00000276256    AC011043.1
16604 ENSG00000273748    AL592183.1
16605 ENSG00000278817    AC007325.4
16606 ENSG00000271254    AC240274.1
mito_genes <- rownames(sce_filtered)[grep(pattern = "^MT-", x = rowData(sce_filtered)$X2)]
mito_genes_counts <- counts(sce_filtered)[mito_genes, ]
percent_mito <- colSums(mito_genes_counts) / sce_filtered$total
hist(percent_mito*100, main = '% of total counts over mitochondrial genes', col = 'wheat')

colData(sce_filtered)$percent_mito <- percent_mito
table(colData(sce_filtered)$percent_mito > 0.1)

FALSE 
 1419 
Question

Remove cells with a % of mitochondrial counts greater than 10%.

R
sce_filtered <- sce_filtered[
    , 
    sce_filtered$percent_mito <= 0.10
]
sce_filtered
class: SingleCellExperiment 
dim: 16606 1419 
metadata(0):
assays(2): counts logcounts
rownames: NULL
rowData names(2): X1 X2
colnames(1419): AAACCTGAGGCTCATT-1 AAACCTGAGGTGCACA-1 ... TTTGTCAGTCTCACCT-1 TTTGTCAGTGAAATCA-1
colData names(8): X1 sum ... discard percent_mito
reducedDimNames(3): PCA TSNE UMAP
mainExpName: NULL
altExpNames(1): ATAC_counts

7.4.3 Checking housekeeping genes

Another metric we use is the number of house keeping genes expressed in a cell. These genes reflect commomn processes active in a cell and hence are a good global quality measure. They are also abundant and are usually steadliy expressed in cells, thus less sensitive to the high dropout.

We first load the list of housekeeping genes (from ~/Share/tirosh_house_keeping.txt), match them to the genes in the rowData of the SingleCellExperiment object (using match and rownames), remove NAs (genes not found in the rowData), and store the list of housekeeping genes in a new variable.

R
# Load the list of housekeeping genes
hkgenes <- read.table("~/Share/tirosh_house_keeping.txt", skip = 2)
hkgenes <- as.vector(hkgenes$V1)
hkgenes <- rownames(sce_filtered)[match(hkgenes, rowData(sce_filtered)$X2)]
hkgenes <- hkgenes[!is.na(hkgenes)]
hkgenes
NULL
Question

Calculate the number of expressed housekeeping genes per cell (genes with a count > 0) and store the number of expressed housekeeping genes per cell in colData.

R
colData(sce_filtered)$n_expressed_hkgenes <- Matrix::colSums(counts(sce_filtered)[hkgenes, ] > 0)
table(colData(sce_filtered)$n_expressed_hkgenes)

   0 
1419 
Question

Plot (in a boxplot) the relationship between the # of detected housekeeping genes and the total UMI count (or # of detected genes) per cell. Comment.

R
colData(sce_filtered)$n_expressed_hkgenes <- Matrix::colSums(counts(sce_filtered)[hkgenes, ] > 0)
boxplot(colData(sce_filtered)$total ~ colData(sce_filtered)$n_expressed_hkgenes)

boxplot(colData(sce_filtered)$detected ~ colData(sce_filtered)$n_expressed_hkgenes)

Question

Remove cells with a # of expressed housekeeping genes greater than 85.

R
sce_filtered <- sce_filtered[, sce_filtered$n_expressed_hkgenes <= 85]
sce_filtered
class: SingleCellExperiment 
dim: 16606 1419 
metadata(0):
assays(2): counts logcounts
rownames: NULL
rowData names(2): X1 X2
colnames(1419): AAACCTGAGGCTCATT-1 AAACCTGAGGTGCACA-1 ... TTTGTCAGTCTCACCT-1 TTTGTCAGTGAAATCA-1
colData names(9): X1 sum ... percent_mito n_expressed_hkgenes
reducedDimNames(3): PCA TSNE UMAP
mainExpName: NULL
altExpNames(1): ATAC_counts

7.4.4 Checking gene set expression

Sometimes we want to ask what is the expression of a gene / a set of a genes across cells. This set of genes may make up a gene expression program we are interested in. Another benefit at looking at gene sets is it reduces the effects of drop outs.

Let’s look at genes involved in the stress signature upon cell dissociation. We calculate these genes average expression levels on the single cell level.

R
genes_dissoc <- c("ATF3", "BTG2", "CEBPB", "CEBPD", "CXCL3", "CXCL2", "CXCL1", "DNAJA1", "DNAJB1", "DUSP1", "EGR1", "FOS", "FOSB", "HSP90AA1", "HSP90AB1", "HSPA1A", "HSPA1B", "HSPA1A", "HSPA1B", "HSPA8", "HSPB1", "HSPE1", "HSPH1", "ID3", "IER2", "JUN", "JUNB", "JUND", "MT1X", "NFKBIA", "NR4A1", "PPP1R15A", "SOCS3", "ZFP36")
genes_dissoc <- rownames(sce_filtered)[match(genes_dissoc, rowData(sce_filtered)$X2)]
genes_dissoc <- unique(genes_dissoc[!is.na(genes_dissoc)])
Question

Calculate the average gene set expression for each cell.

R
ave_expr_genes_dissoc <- colMeans(logcounts(sce_filtered[genes_dissoc, ]))
colData(sce_filtered)$ave_expr_genes_dissoc <- ave_expr_genes_dissoc
Question

Plot an embedding of the dataset, using a color scale representing the average expression of genes involved in the stress signature upon cell dissociation. Comment.

R
plotReducedDim(sce_filtered, dimred = 'PCA', colour_by = 'ave_expr_genes_dissoc')

7.5 Session info

─ Session info ───────────────────────────────────────────────────────────────────────────────────────────────────────────────────────────────────────────────────────────────────────────────────────
 setting  value
 version  R version 4.4.1 (2024-06-14)
 os       macOS Sonoma 14.6.1
 system   aarch64, darwin20
 ui       X11
 language (EN)
 collate  en_US.UTF-8
 ctype    en_US.UTF-8
 tz       Europe/Paris
 date     2024-11-03
 pandoc   2.19.2 @ /opt/homebrew/bin/ (via rmarkdown)

─ Packages ───────────────────────────────────────────────────────────────────────────────────────────────────────────────────────────────────────────────────────────────────────────────────────────
 package              * version date (UTC) lib source
 abind                  1.4-8   2024-09-12 [1] CRAN (R 4.4.1)
 beachmat               2.20.0  2024-05-06 [1] Bioconduc~
 beeswarm               0.4.0   2021-06-01 [1] CRAN (R 4.4.0)
 Biobase              * 2.64.0  2024-04-30 [1] Bioconduc~
 BiocGenerics         * 0.50.0  2024-04-30 [1] Bioconduc~
 BiocNeighbors          1.22.0  2024-04-30 [1] Bioconduc~
 BiocParallel           1.38.0  2024-04-30 [1] Bioconduc~
 BiocSingular           1.20.0  2024-04-30 [1] Bioconduc~
 bit                    4.5.0   2024-09-20 [1] CRAN (R 4.4.1)
 bit64                  4.5.2   2024-09-22 [1] CRAN (R 4.4.1)
 cachem                 1.1.0   2024-05-16 [1] CRAN (R 4.4.0)
 cli                    3.6.3   2024-06-21 [1] CRAN (R 4.4.0)
 codetools              0.2-20  2024-03-31 [1] CRAN (R 4.4.1)
 colorspace             2.1-1   2024-07-26 [1] CRAN (R 4.4.0)
 cowplot                1.1.3   2024-01-22 [1] CRAN (R 4.4.0)
 crayon                 1.5.3   2024-06-20 [1] CRAN (R 4.4.0)
 DelayedArray           0.30.1  2024-05-30 [1] Bioconduc~
 DelayedMatrixStats     1.26.0  2024-04-30 [1] Bioconduc~
 devtools               2.4.5   2022-10-11 [1] CRAN (R 4.4.0)
 digest                 0.6.37  2024-08-19 [1] CRAN (R 4.4.1)
 dplyr                * 1.1.4   2023-11-17 [1] CRAN (R 4.4.0)
 ellipsis               0.3.2   2021-04-29 [1] CRAN (R 4.4.0)
 evaluate               1.0.1   2024-10-10 [1] CRAN (R 4.4.1)
 fansi                  1.0.6   2023-12-08 [1] CRAN (R 4.4.0)
 farver                 2.1.2   2024-05-13 [1] CRAN (R 4.4.0)
 fastmap                1.2.0   2024-05-15 [1] CRAN (R 4.4.0)
 FNN                    1.1.4.1 2024-09-22 [1] CRAN (R 4.4.1)
 forcats              * 1.0.0   2023-01-29 [1] CRAN (R 4.4.0)
 fs                     1.6.4   2024-04-25 [1] CRAN (R 4.4.0)
 generics               0.1.3   2022-07-05 [1] CRAN (R 4.4.0)
 GenomeInfoDb         * 1.40.1  2024-06-16 [1] Bioconduc~
 GenomeInfoDbData       1.2.12  2024-10-29 [1] Bioconductor
 GenomicRanges        * 1.56.2  2024-10-09 [1] Bioconduc~
 ggbeeswarm             0.7.2   2023-04-29 [1] CRAN (R 4.4.0)
 ggplot2              * 3.5.1   2024-04-23 [1] CRAN (R 4.4.0)
 ggrepel                0.9.6   2024-09-07 [1] CRAN (R 4.4.1)
 glue                   1.8.0   2024-09-30 [1] CRAN (R 4.4.1)
 gridExtra              2.3     2017-09-09 [1] CRAN (R 4.4.0)
 gtable                 0.3.6   2024-10-25 [1] CRAN (R 4.4.1)
 hms                    1.1.3   2023-03-21 [1] CRAN (R 4.4.0)
 htmltools              0.5.8.1 2024-04-04 [1] CRAN (R 4.4.0)
 htmlwidgets            1.6.4   2023-12-06 [1] CRAN (R 4.4.0)
 httpuv                 1.6.15  2024-03-26 [1] CRAN (R 4.4.0)
 httr                   1.4.7   2023-08-15 [1] CRAN (R 4.4.0)
 IRanges              * 2.38.1  2024-07-03 [1] Bioconduc~
 irlba                  2.3.5.1 2022-10-03 [1] CRAN (R 4.4.0)
 jsonlite               1.8.9   2024-09-20 [1] CRAN (R 4.4.1)
 knitr                  1.48    2024-07-07 [1] CRAN (R 4.4.0)
 labeling               0.4.3   2023-08-29 [1] CRAN (R 4.4.0)
 later                  1.3.2   2023-12-06 [1] CRAN (R 4.4.0)
 lattice                0.22-6  2024-03-20 [1] CRAN (R 4.4.1)
 lifecycle              1.0.4   2023-11-07 [1] CRAN (R 4.4.0)
 lubridate            * 1.9.3   2023-09-27 [1] CRAN (R 4.4.0)
 magrittr               2.0.3   2022-03-30 [1] CRAN (R 4.4.0)
 Matrix                 1.7-1   2024-10-18 [1] CRAN (R 4.4.1)
 MatrixGenerics       * 1.16.0  2024-04-30 [1] Bioconduc~
 matrixStats          * 1.4.1   2024-09-08 [1] CRAN (R 4.4.1)
 memoise                2.0.1   2021-11-26 [1] CRAN (R 4.4.0)
 mime                   0.12    2021-09-28 [1] CRAN (R 4.4.0)
 miniUI                 0.1.1.1 2018-05-18 [1] CRAN (R 4.4.0)
 munsell                0.5.1   2024-04-01 [1] CRAN (R 4.4.0)
 pillar                 1.9.0   2023-03-22 [1] CRAN (R 4.4.0)
 pkgbuild               1.4.5   2024-10-28 [1] CRAN (R 4.4.1)
 pkgconfig              2.0.3   2019-09-22 [1] CRAN (R 4.4.0)
 pkgload                1.4.0   2024-06-28 [1] CRAN (R 4.4.0)
 profvis                0.4.0   2024-09-20 [1] CRAN (R 4.4.1)
 promises               1.3.0   2024-04-05 [1] CRAN (R 4.4.0)
 purrr                * 1.0.2   2023-08-10 [1] CRAN (R 4.4.0)
 R6                     2.5.1   2021-08-19 [1] CRAN (R 4.4.0)
 Rcpp                   1.0.13  2024-07-17 [1] CRAN (R 4.4.0)
 readr                * 2.1.5   2024-01-10 [1] CRAN (R 4.4.0)
 remotes                2.5.0   2024-03-17 [1] CRAN (R 4.4.0)
 rlang                  1.1.4   2024-06-04 [1] CRAN (R 4.4.0)
 rmarkdown              2.28    2024-08-17 [1] CRAN (R 4.4.0)
 rsvd                   1.0.5   2021-04-16 [1] CRAN (R 4.4.0)
 Rtsne                  0.17    2023-12-07 [1] CRAN (R 4.4.0)
 S4Arrays               1.4.1   2024-05-30 [1] Bioconduc~
 S4Vectors            * 0.42.1  2024-07-03 [1] Bioconduc~
 ScaledMatrix           1.12.0  2024-04-30 [1] Bioconduc~
 scales                 1.3.0   2023-11-28 [1] CRAN (R 4.4.0)
 scater               * 1.32.1  2024-07-21 [1] Bioconduc~
 scuttle              * 1.14.0  2024-04-30 [1] Bioconduc~
 sessioninfo            1.2.2   2021-12-06 [1] CRAN (R 4.4.0)
 shiny                  1.9.1   2024-08-01 [1] CRAN (R 4.4.0)
 SingleCellExperiment * 1.26.0  2024-04-30 [1] Bioconduc~
 SparseArray            1.4.8   2024-05-30 [1] Bioconduc~
 sparseMatrixStats      1.16.0  2024-04-30 [1] Bioconduc~
 stringi                1.8.4   2024-05-06 [1] CRAN (R 4.4.0)
 stringr              * 1.5.1   2023-11-14 [1] CRAN (R 4.4.0)
 SummarizedExperiment * 1.34.0  2024-04-30 [1] Bioconduc~
 tibble               * 3.2.1   2023-03-20 [1] CRAN (R 4.4.0)
 tidyr                * 1.3.1   2024-01-24 [1] CRAN (R 4.4.0)
 tidyselect             1.2.1   2024-03-11 [1] CRAN (R 4.4.0)
 tidyverse            * 2.0.0   2023-02-22 [1] CRAN (R 4.4.0)
 timechange             0.3.0   2024-01-18 [1] CRAN (R 4.4.0)
 tzdb                   0.4.0   2023-05-12 [1] CRAN (R 4.4.0)
 UCSC.utils             1.0.0   2024-05-06 [1] Bioconduc~
 urlchecker             1.0.1   2021-11-30 [1] CRAN (R 4.4.0)
 usethis                3.0.0   2024-07-29 [1] CRAN (R 4.4.0)
 utf8                   1.2.4   2023-10-22 [1] CRAN (R 4.4.0)
 uwot                   0.2.2   2024-04-21 [1] CRAN (R 4.4.0)
 vctrs                  0.6.5   2023-12-01 [1] CRAN (R 4.4.0)
 vipor                  0.4.7   2023-12-18 [1] CRAN (R 4.4.0)
 viridis                0.6.5   2024-01-29 [1] CRAN (R 4.4.0)
 viridisLite            0.4.2   2023-05-02 [1] CRAN (R 4.4.0)
 vroom                  1.6.5   2023-12-05 [1] CRAN (R 4.4.0)
 withr                  3.0.2   2024-10-28 [1] CRAN (R 4.4.1)
 xfun                   0.48    2024-10-03 [1] CRAN (R 4.4.1)
 xtable                 1.8-4   2019-04-21 [1] CRAN (R 4.4.0)
 XVector                0.44.0  2024-04-30 [1] Bioconduc~
 zlibbioc               1.50.0  2024-04-30 [1] Bioconduc~

 [1] /Library/Frameworks/R.framework/Versions/4.4-arm64/Resources/library

──────────────────────────────────────────────────────────────────────────────────────────────────────────────────────────────────────────────────────────────────────────────────────────────────────