Main functions
The two main user-level functions of periodicDNA are getPeriodicity() and getPeriodicityTrack().
-
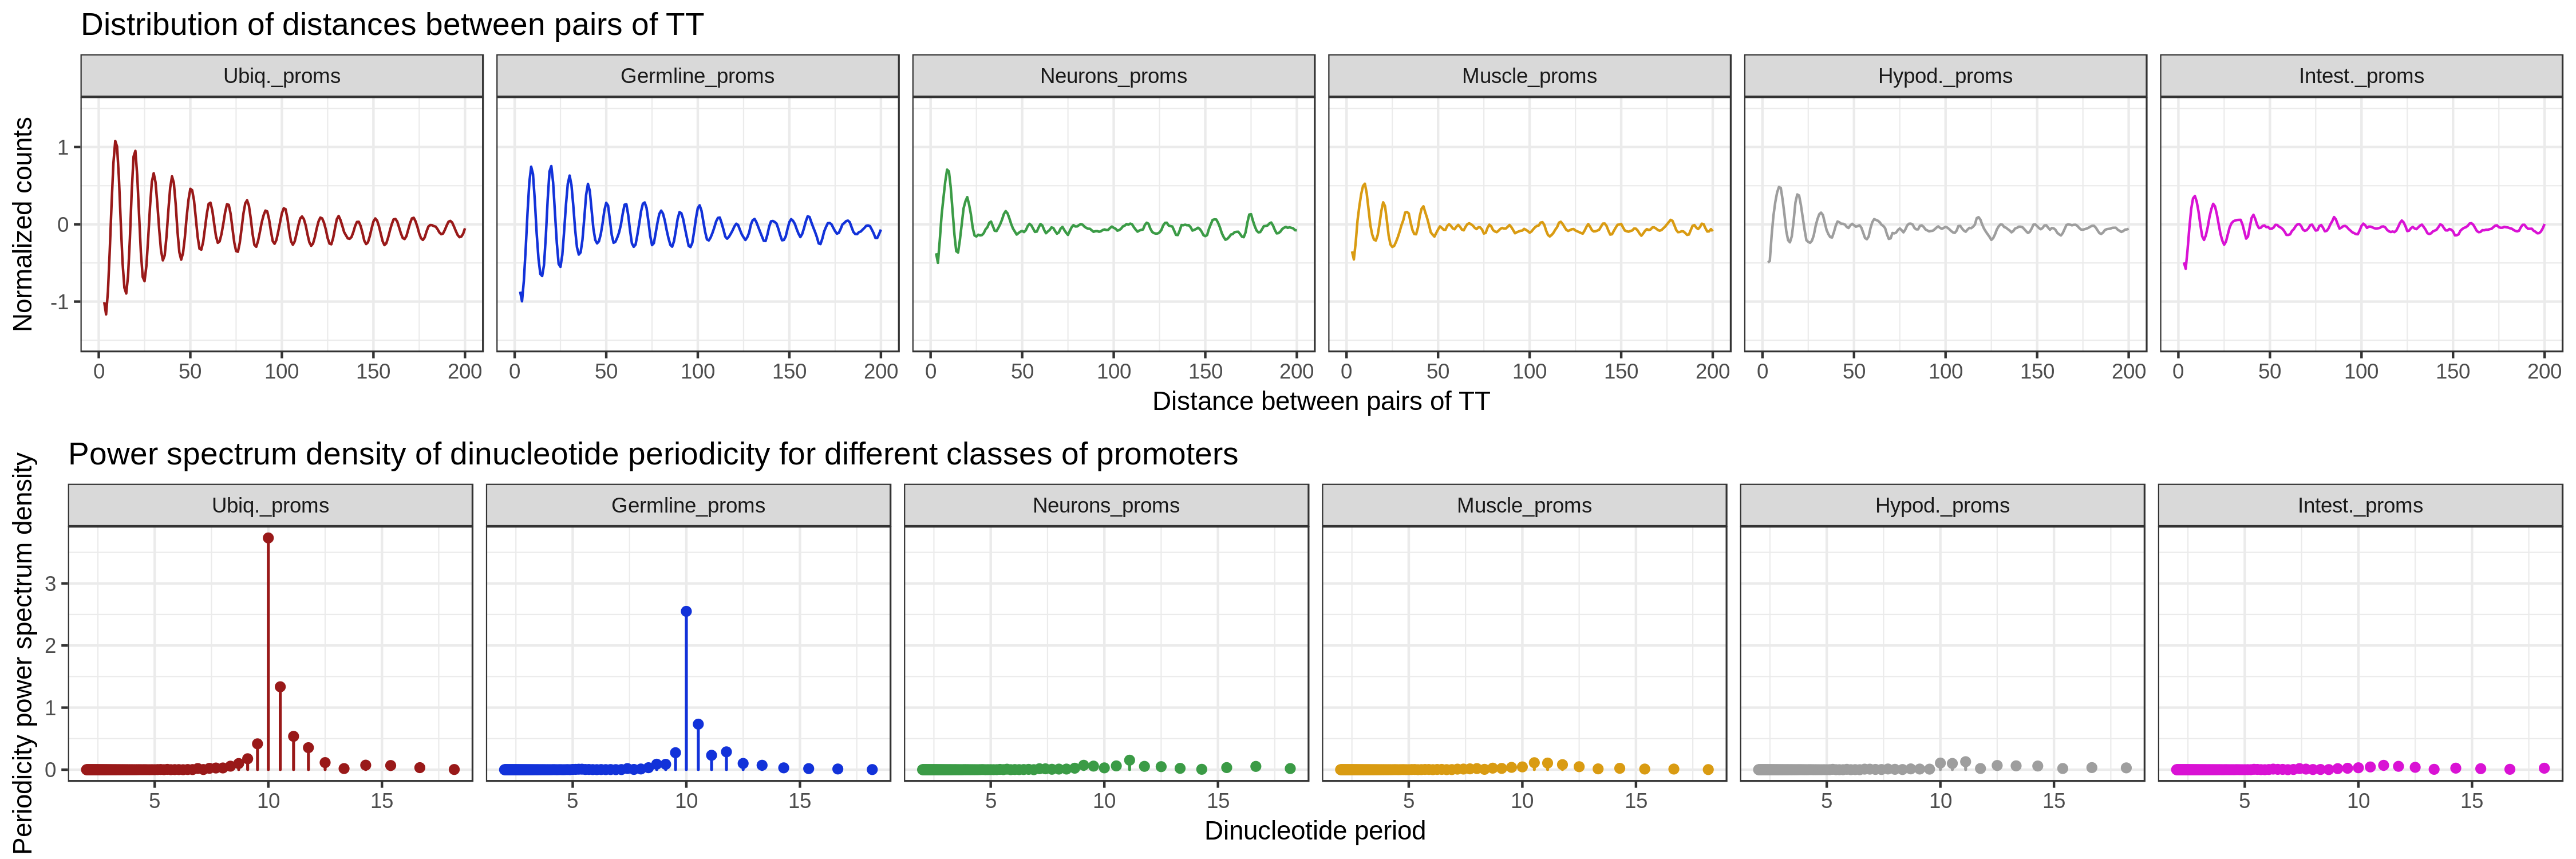
getPeriodicity()is used to compute the power spectral density (PSD) of a chosen k-mer (i.e.TT) in a set of sequences. The PSD score at a given period indicates the strength of the k-mer at this period. -
getPeriodicityTrack()can be used to generate linear tracks representing the periodicity strength of a given k-mer at a chosen period, over genomic loci of interest.
getPeriodicity() function
data(ce11_TSSs)
PSDs <- getPeriodicity(
    ce11_TSSs[['Ubiq.']],
    genome = 'BSgenome.Celegans.UCSC.ce11',
    motif = 'TT',
    BPPARAM = MulticoreParam(12),
    n_shuffling = 100
)
plotPeriodicityResults(PSDs)
getPeriodicityTrack() function
data(ce11_proms)
WW_10bp <- getPeriodicityTrack(
    genome = 'BSgenome.Celegans.UCSC.ce11',
    granges = ce11_proms,
    motif = 'WW',
    period = 10,
    bw_file = 'WW-10-bp-periodicity_over-proms.bw',
    BPPARAM = MulticoreParam(12)
)Warning: It is recommended to run this command across many processors using BiocParallel. This command typically takes one day to produce a periodicity track over 15,000 GRanges of 150 bp (with default parameters) using BPPARAM = MulticoreParam(12). It is highly recommended to run this command in a new screen session.


