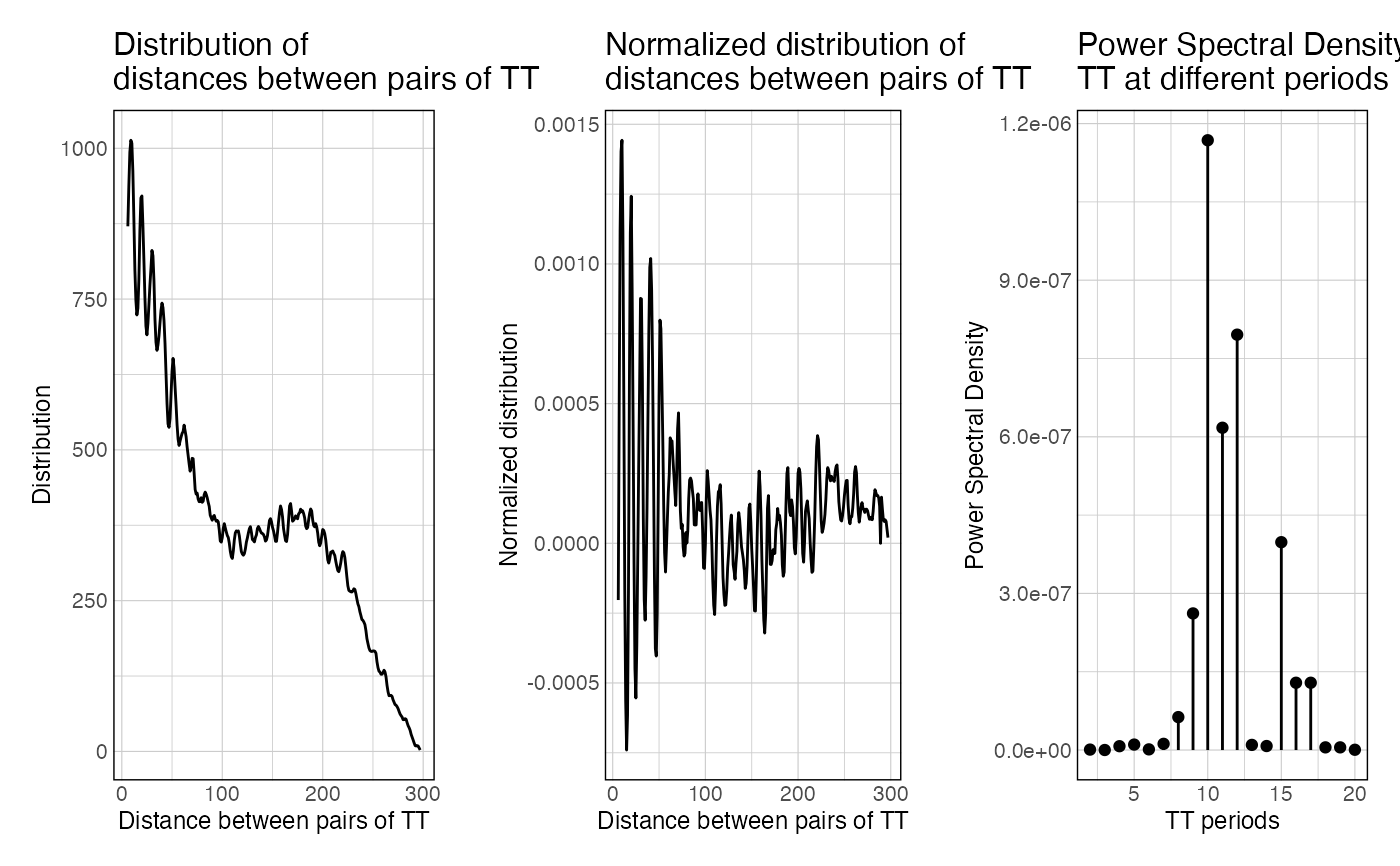
This function takes a set of sequences and a k-mer of interest, map a k-mer of interest in these sequences, computes all the pairwise distances (distogram), normalize it for distance decay, and computes the resulting power spectral density of the normalized distogram.
getPeriodicity(x, motif, ...)

# S3 method for DNAStringSet
getPeriodicity(
  x,
  motif,
  range_spectrum = seq(1, 200),
  BPPARAM = setUpBPPARAM(1),
  roll = 3,
  verbose = TRUE,
  sample = 0,
  n_shuffling = 0,
  cores_shuffling = 1,
  cores_computing = 1,
  order = 1,
  ...
)

# S3 method for GRanges
getPeriodicity(x, motif, genome = "BSgenome.Celegans.UCSC.ce11", ...)

# S3 method for DNAString
getPeriodicity(x, motif, ...)
Arguments
| x | a DNAString, DNAStringSet or GRanges object. |
|---|---|
| motif | a k-mer of interest |
| ... | Arguments passed to S3 methods |
| range_spectrum | Numeric vector Range of the distogram to use to run the Fast Fourier Transform on (default: 1:200, i.e. all pairs of k-mers at a maximum of 200 bp from each other). |
| BPPARAM | split the workload over several processors using BiocParallel |
| roll | Integer Window to smooth the distribution of pairwise distances (default: 3, to discard the 3-bp periodicity of dinucleotides which can be very strong in vertebrate genomes) |
| verbose | Boolean |
| sample | Integer if > 0, will randomly sample this many integers from the dists vector before normalization. This ensures consistency when looking at periodicity in different genomes, since different genomes will have different GC percent |
| n_shuffling | Integer, how many times should the sequences be shuffled? (default = 0) |
| cores_shuffling | integer, Number of cores used for shuffling (used if n_shuffling > 0) |
| cores_computing | integer, split the workload over several processors using BiocParallel (used if n_shuffling > 0) |
| order | Integer, which order to take into consideration for shuffling (ushuffle python library must be installed for orders > 1) (used if n_shuffling > 0) |
| genome | genome ID, BSgenome or DNAStringSet object (optional, if x is a GRanges) |
Value
A list containing the results of getPeriodicity function.
The dists vector is the raw vector of all distances between any possible k-mer.
The hist data.frame is the distribution of distances over range_spectrum.
The normalized_hist is the raw hist, normalized for decay over increasing distances.
The spectra object is the output of the FFT applied over normalized_hist.
The PSD data frame is the power spectral density scores over given frequencies.
The motif object is the k-mer being analysed.
The final periodicity metrics computed by getPeriodicity()
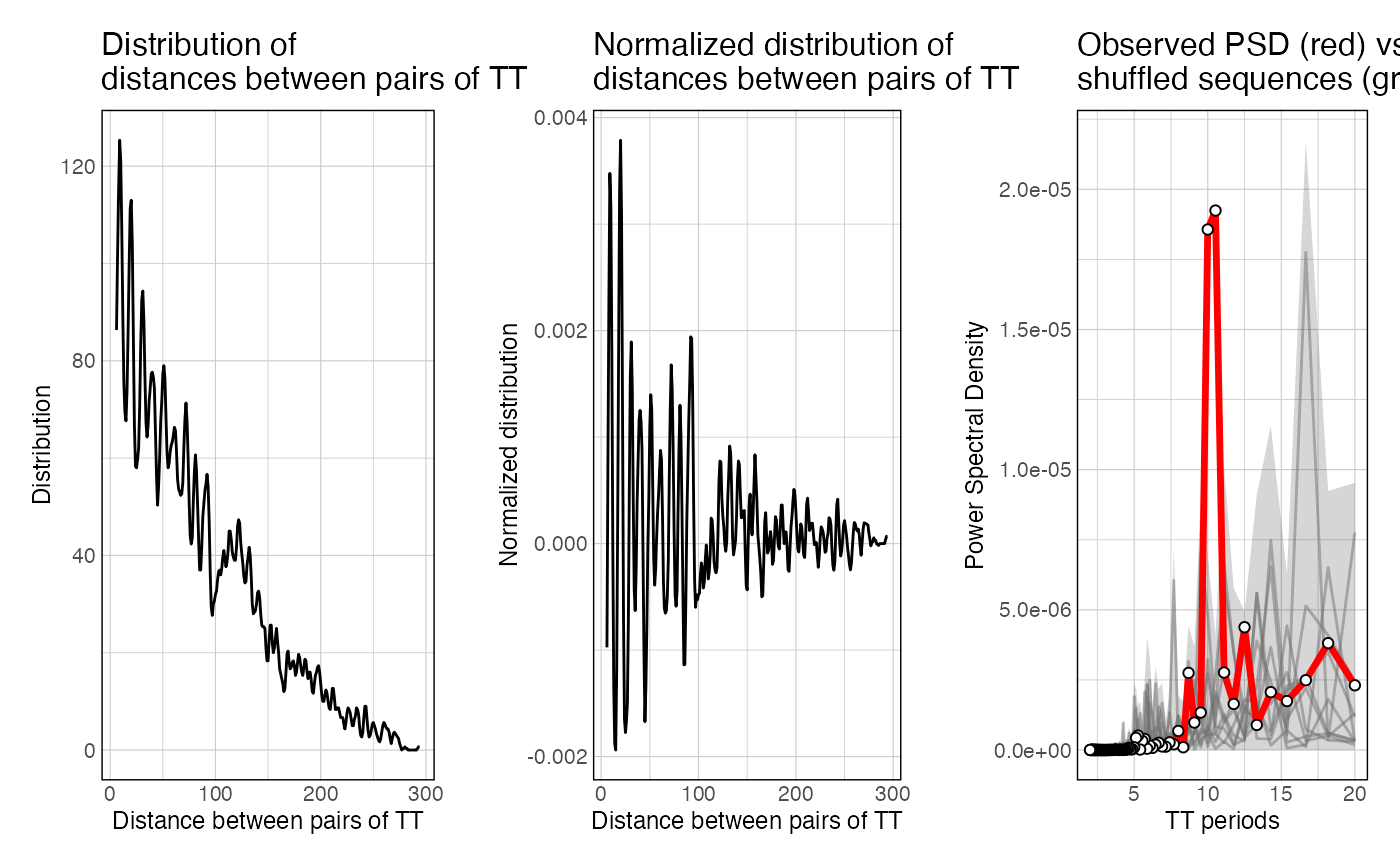
If getPeriodicity() is ran with n_shuffling > 0, the resulting list also contains PSD values computed when iterating through shuffled sequences.
Methods (by class)
DNAStringSet: S3 method for DNAStringSetGRanges: S3 method for GRangesDNAString: S3 method for DNAString
Examples
#>#>#>#>#>#> freq period PSD #> 1 0.005 200.00000 1.584561e-07 #> 2 0.010 100.00000 1.089625e-07 #> 3 0.015 66.66667 6.058472e-08 #> 4 0.020 50.00000 7.158697e-08 #> 5 0.025 40.00000 7.167191e-10 #> 6 0.030 33.33333 3.050591e-08# data(ce11_TSSs) periodicity_result <- getPeriodicity( ce11_TSSs[['Ubiq.']][1:10], motif = 'TT', genome = 'BSgenome.Celegans.UCSC.ce11' )#>#>#>#>#>#> freq period PSD #> 1 0.005 200.00000 7.869046e-08 #> 2 0.010 100.00000 4.304990e-08 #> 3 0.015 66.66667 1.323240e-06 #> 4 0.020 50.00000 4.524673e-07 #> 5 0.025 40.00000 3.453647e-07 #> 6 0.030 33.33333 4.240164e-07# data(ce11_TSSs) periodicity_result <- getPeriodicity( ce11_TSSs[['Ubiq.']][1:10], motif = 'TT', genome = 'BSgenome.Celegans.UCSC.ce11', n_shuffling = 10 )#>#>#>#>#>#>#>#>#>#>#>#>#>#>#>#>#>#> freq period PSD #> 1 0.005 200.00000 7.869046e-08 #> 2 0.010 100.00000 4.304990e-08 #> 3 0.015 66.66667 1.323240e-06 #> 4 0.020 50.00000 4.524673e-07 #> 5 0.025 40.00000 3.453647e-07 #> 6 0.030 33.33333 4.240164e-07