A function to plot aggregated signals over sets of GRanges
Source:R/GRanges.R
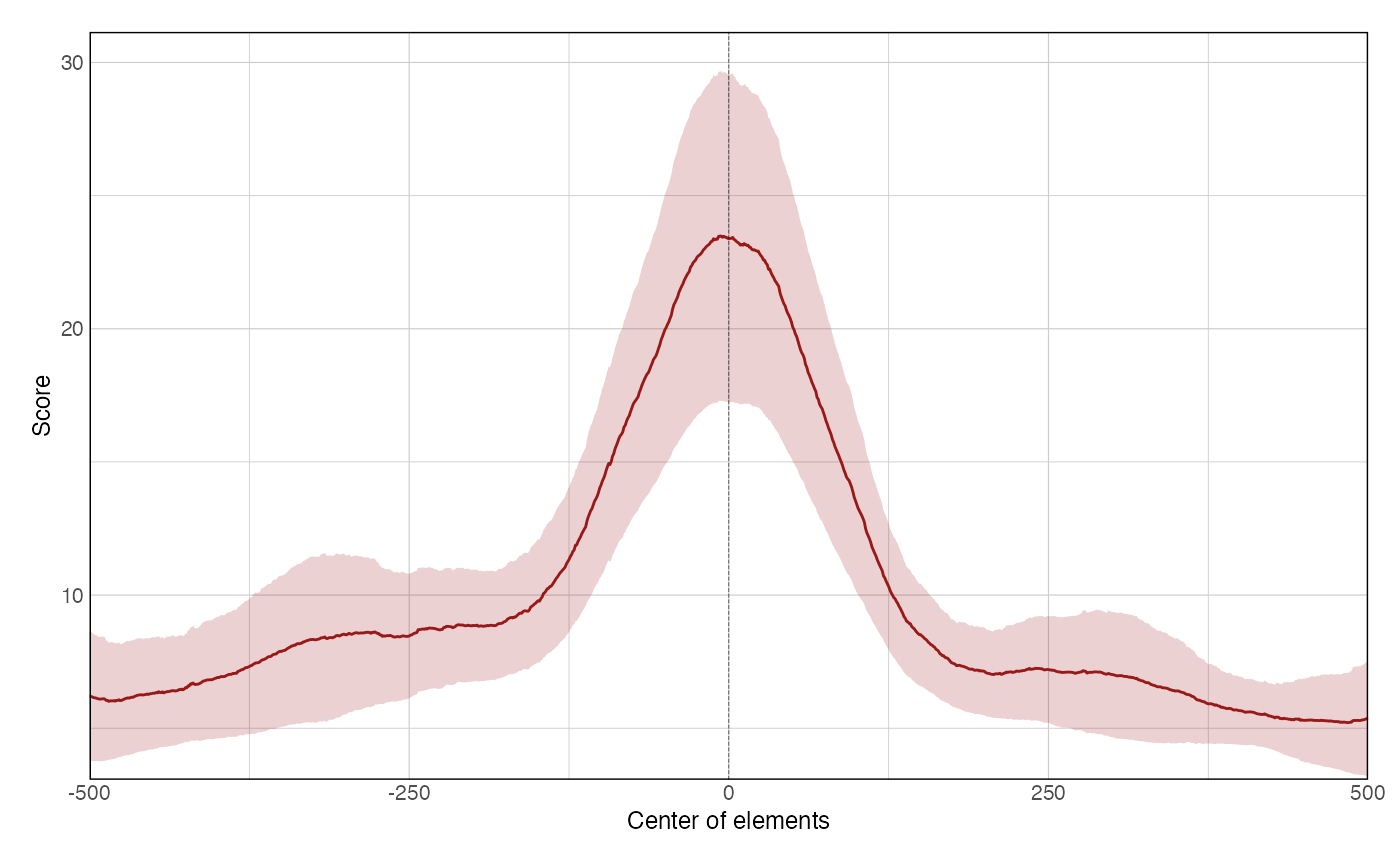
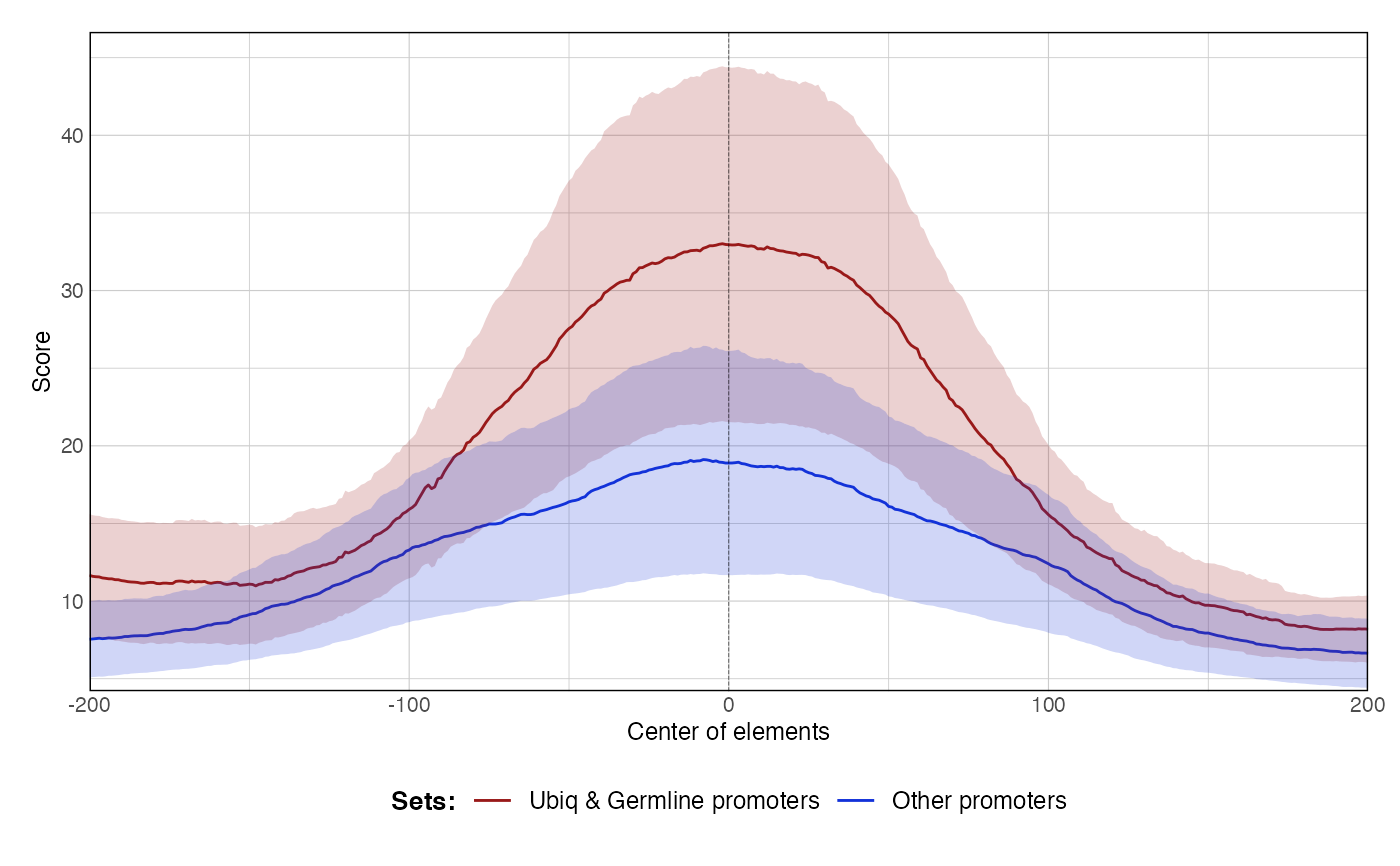
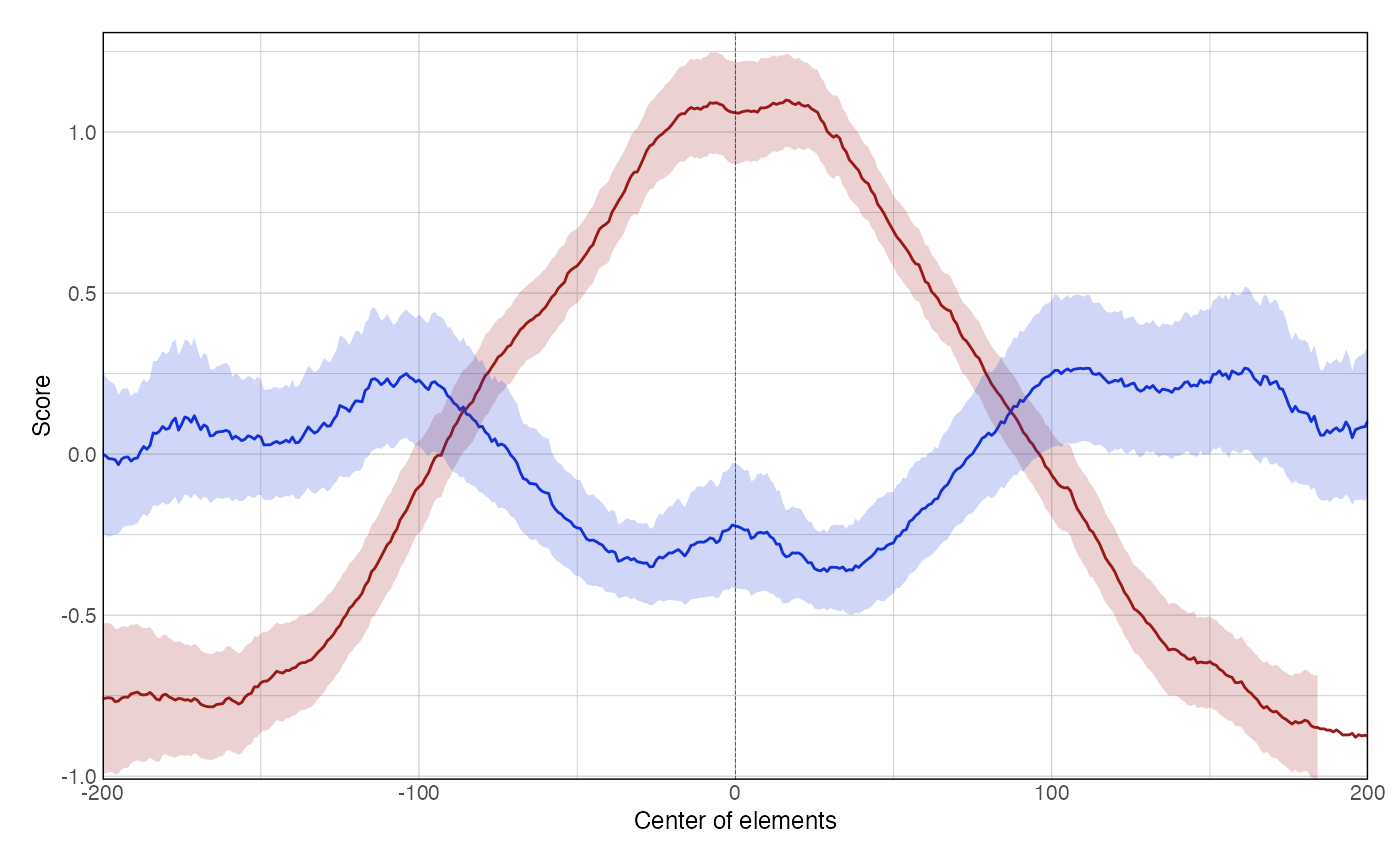
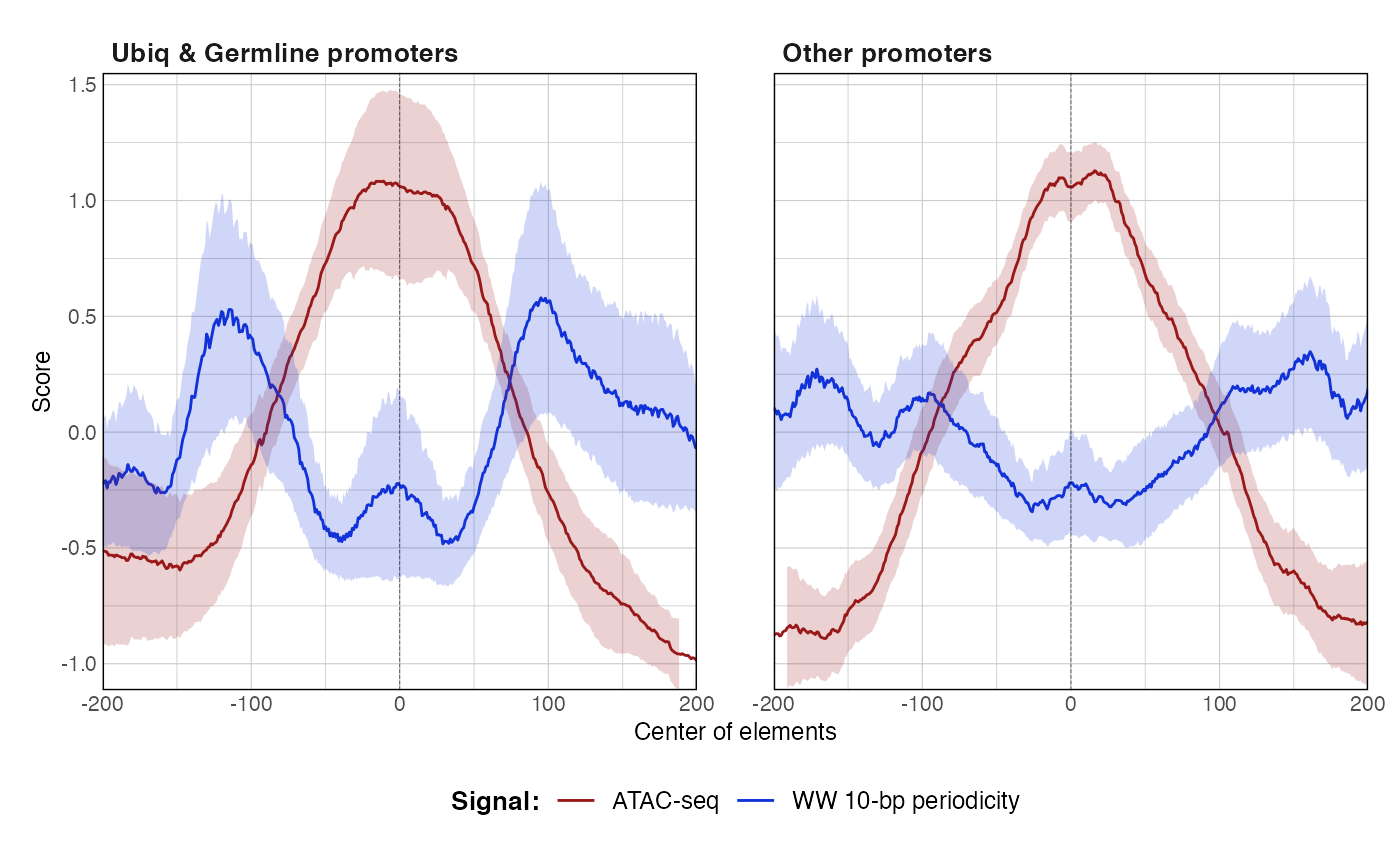
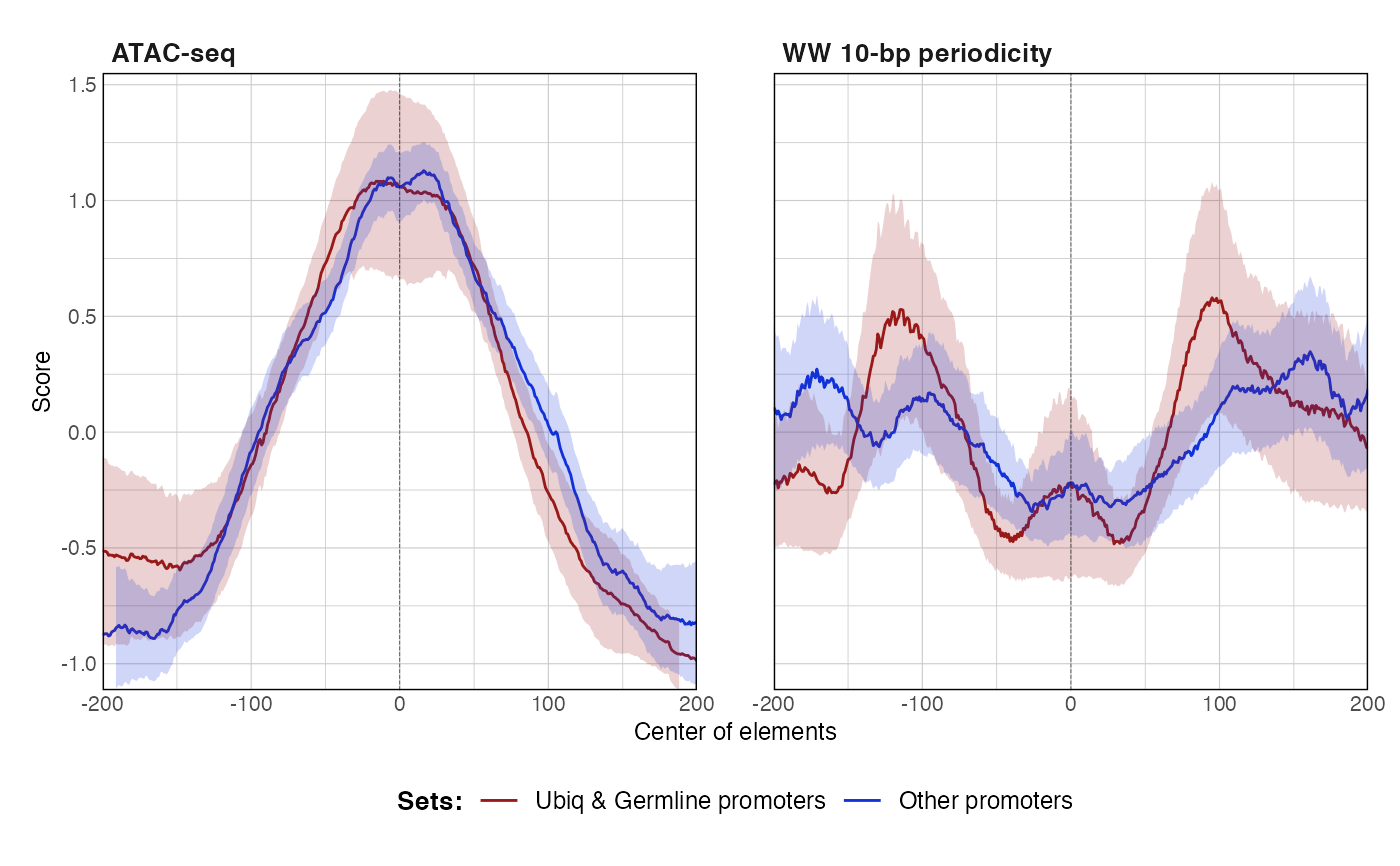
plotAggregateCoverage.RdThis function takes one or several RleList genomic tracks (e.g. imported by rtraklayer::import(..., as = 'Rle')) and one or several GRanges objects. It computes coverage of the GRanges by the genomic tracks and returns an aggregate coverage plot.
plotAggregateCoverage(x, ...)

# S3 method for CompressedRleList
plotAggregateCoverage(x, granges, ...)

# S3 method for SimpleRleList
plotAggregateCoverage(
  x,
  granges,
  colors = NULL,
  xlab = "Center of elements",
  ylab = "Score",
  xlim = NULL,
  ylim = NULL,
  quartiles = c(0.025, 0.975),
  verbose = FALSE,
  bin = 1,
  plot_central = TRUE,
  run_in_parallel = FALSE,
  split_by_granges = FALSE,
  norm = "none",
  ...
)

# S3 method for list
plotAggregateCoverage(
  x,
  granges,
  colors = NULL,
  xlab = "Center of elements",
  ylab = "Score",
  xlim = NULL,
  ylim = NULL,
  quartiles = c(0.025, 0.975),
  verbose = FALSE,
  bin = 1,
  plot_central = TRUE,
  split_by_granges = TRUE,
  split_by_track = FALSE,
  free_scales = FALSE,
  run_in_parallel = FALSE,
  norm = "none",
  ...
)
Arguments
| x | a single signal track (CompressedRleList or SimpleRleList class), or several signal tracks (SimpleRleList or CompressedRleList class) grouped in a named list |
|---|---|
| ... | additional parameters |
| granges | a GRanges object or a named list of GRanges |
| colors | a vector of colors |
| xlab | x axis label |
| ylab | y axis label |
| xlim | y axis limits |
| ylim | y axis limits |
| quartiles | Which quantiles to use to determine y scale automatically? |
| verbose | Boolean |
| bin | Integer Width of the window to use to smooth values by zoo::rollMean |
| plot_central | Boolean Draw a vertical line at 0 |
| run_in_parallel | Boolean Should the plots be computed in parallel using mclapply? |
| split_by_granges | Boolean Facet plots over the sets of GRanges |
| norm | character Should the signal be normalized ('none', 'zscore' or 'log2')? |
| split_by_track | Boolean Facet plots by the sets of signal tracks |
| free_scales | Boolean Should each facet have independent y-axis scales? |
Value
An aggregate coverage plot.
Methods (by class)
CompressedRleList: S3 method for CompressedRleListSimpleRleList: S3 method for SimpleRleListlist: S3 method for list
Examples
data(ce11_ATACseq) data(ce11_WW_10bp) data(ce11_proms) p1 <- plotAggregateCoverage( ce11_ATACseq, resize(ce11_proms[1:100], fix = 'center', width = 1000) ) p1proms <- resize(ce11_proms[1:100], fix = 'center', width = 400) p2 <- plotAggregateCoverage( ce11_ATACseq, list( 'Ubiq & Germline promoters' = proms[proms$which.tissues %in% c('Ubiq.', 'Germline')], 'Other promoters' = proms[!(proms$which.tissues %in% c('Ubiq.', 'Germline'))] ) ) p2p3 <- plotAggregateCoverage( list( 'atac' = ce11_ATACseq, 'WW_10bp' = ce11_WW_10bp ), proms, norm = 'zscore' ) p3p4 <- plotAggregateCoverage( list( 'ATAC-seq' = ce11_ATACseq, 'WW 10-bp periodicity' = ce11_WW_10bp ), list( 'Ubiq & Germline promoters' = proms[proms$which.tissues %in% c('Ubiq.', 'Germline')], 'Other promoters' = proms[!(proms$which.tissues %in% c('Ubiq.', 'Germline'))] ), norm = 'zscore' ) p4p5 <- plotAggregateCoverage( list( 'ATAC-seq' = ce11_ATACseq, 'WW 10-bp periodicity' = ce11_WW_10bp ), list( 'Ubiq & Germline promoters' = proms[proms$which.tissues %in% c('Ubiq.', 'Germline')], 'Other promoters' = proms[!(proms$which.tissues %in% c('Ubiq.', 'Germline'))] ), split_by_granges = FALSE, split_by_track = TRUE, norm = 'zscore' ) p5