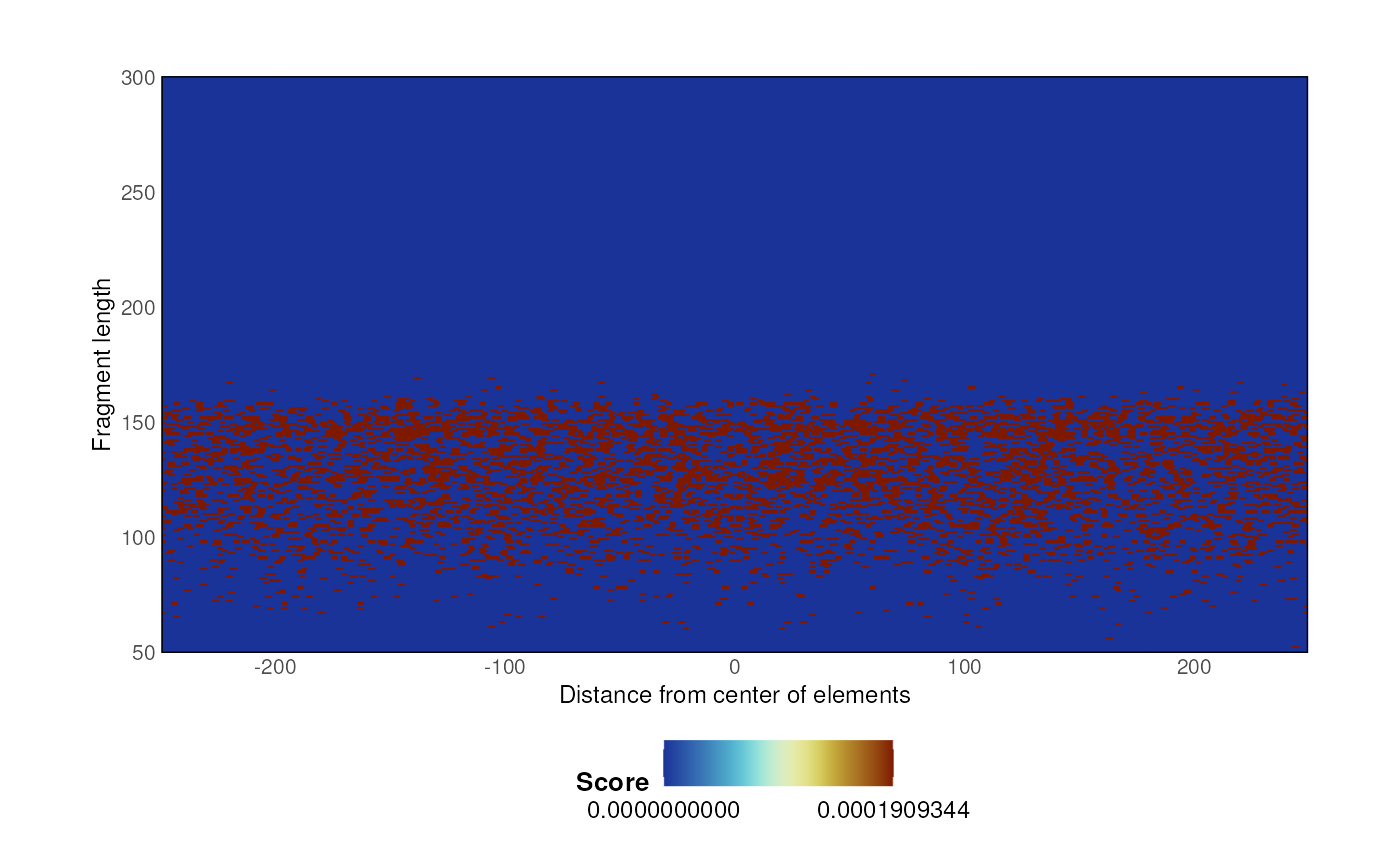
The default plotVmat method generates a ggplot representing a heatmap of fragment density.
Arguments
- x
A computed Vmat (ideally, should be normalized)
- hm
Integer, should be between 0 and 100. Used to automatically scale the range of colors (best to keep between 90 and 100)
- colors
a vector of colors
- breaks
a vector of breaks. length(breaks) == length(colors) + 1
- xlim
vector of two integers, x limits
- ylim
vector of two integers, y limits
- main
character, title of the plot
- xlab
character, x-axis label
- ylab
character, y-axis label
- key
character, legend label
- ...
additional parameters
Value
A Vmat ggplot