A function to plot footprint of paired-end data at given loci
Source:R/footprint.R
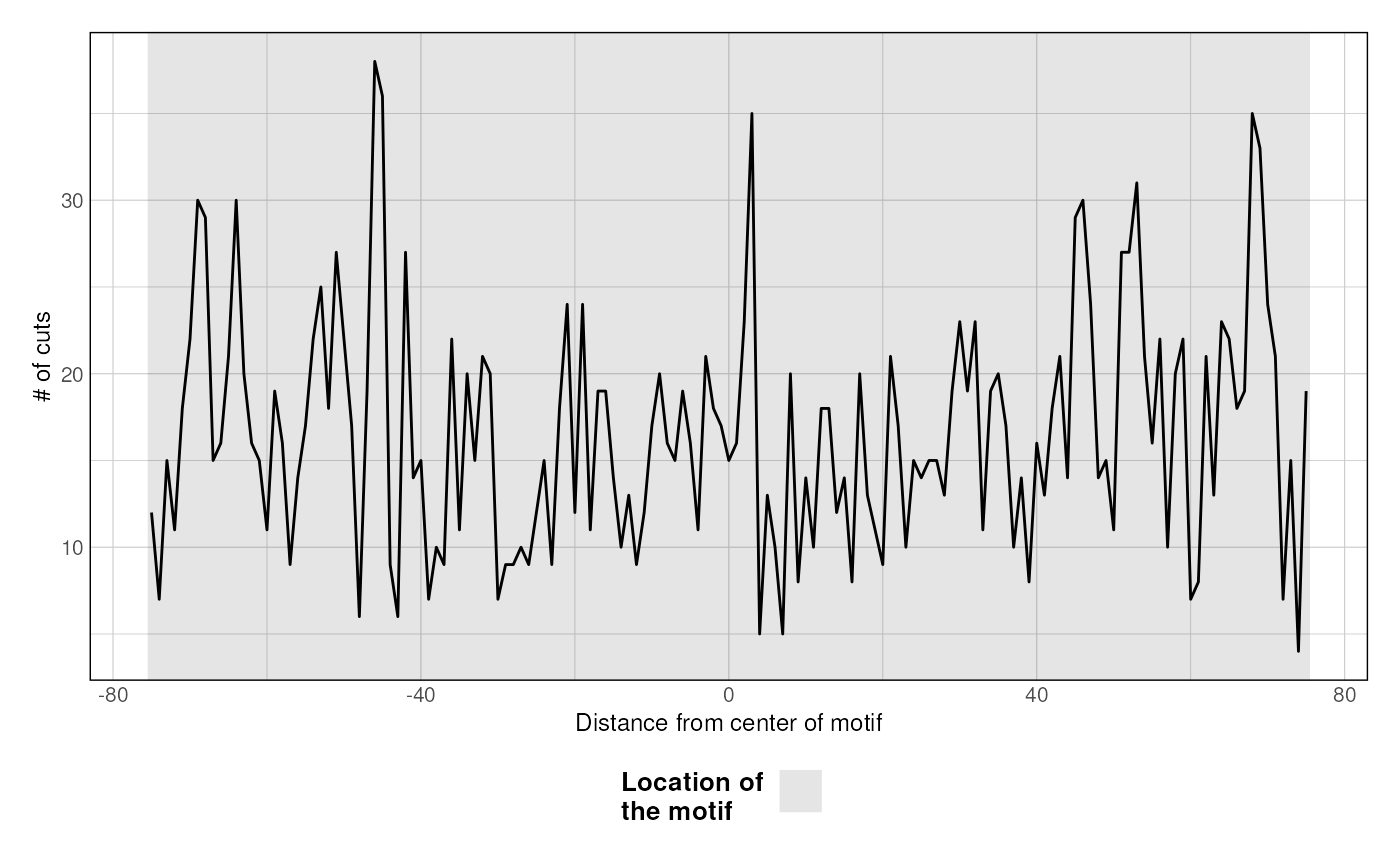
plotFootprint.RdThis function takes paired-end fragments, extract the "cuts" (i.e. extremities) and plot the footprint profile over a set of GRanges.
plotFootprint(
  frags,
  targets,
  split_strand = FALSE,
  plot_central = TRUE,
  xlim = c(-75, 75),
  bin = 1,
  verbose = 1
)
Arguments
- frags
GRanges, the paired-end fragments
- targets
GRanges, the loci to map the fragments onto
- split_strand
Boolean, should the + and - strand be splitted?
- plot_central
plot grey rectangle over the loci
- xlim
numeric vector of length 2, the x limits of the computed Vmat
- bin
Integer, bin used to smooth the gootprint profile
- verbose
Integer
Value
A footprint ggplot