Plotting a P(s) distance law
Arguments
Value
ggplot
Examples
## Single P(s)

contacts_yeast <- contacts_yeast()
#> see ?HiContactsData and browseVignettes('HiContactsData') for documentation
#> loading from cache
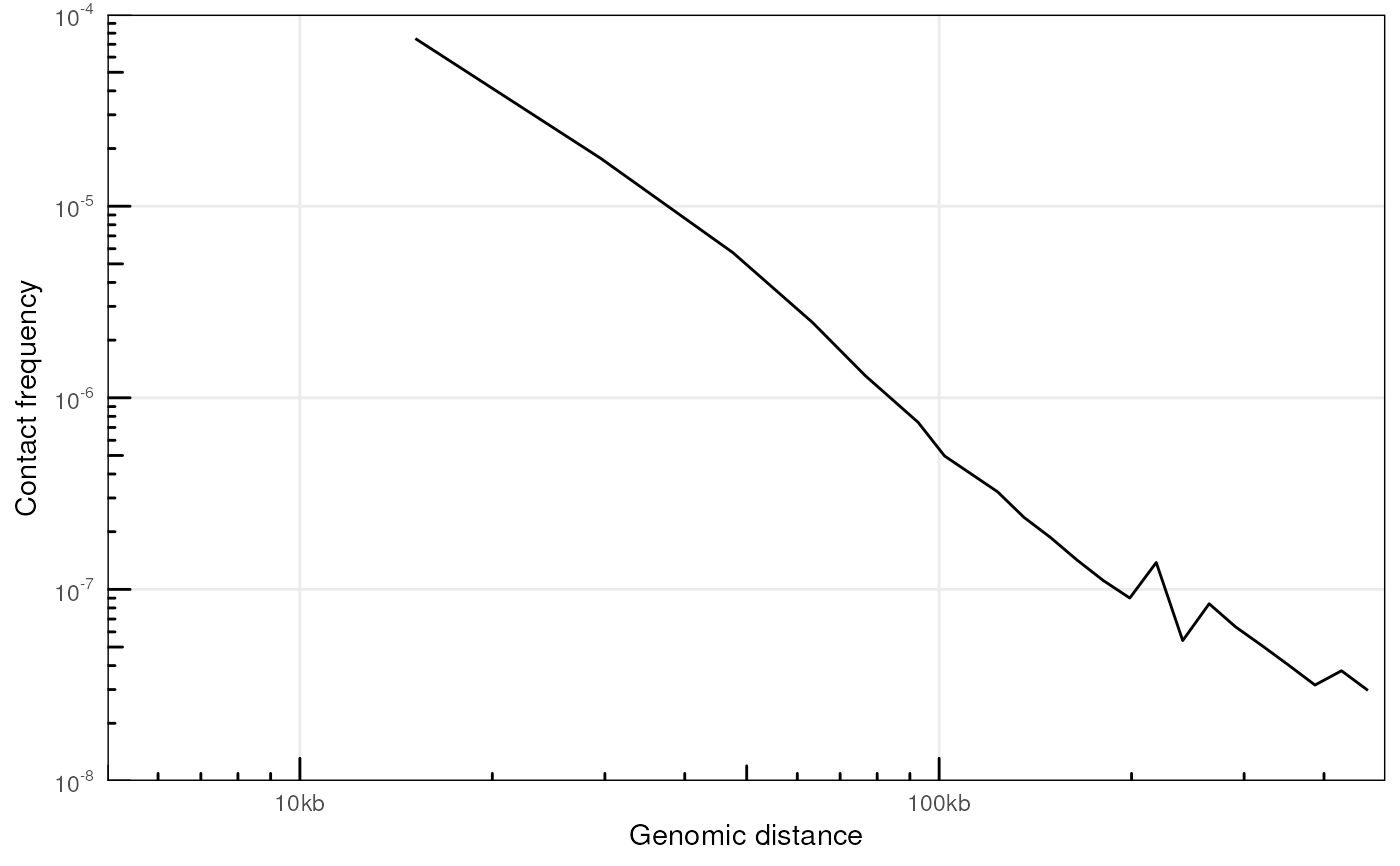
ps <- distanceLaw(contacts_yeast)
#> pairsFile not specified. The P(s) curve will be an approximation.
plotPs(ps, ggplot2::aes(x = binned_distance, y = norm_p))
#> Warning: Removed 13 rows containing missing values or values outside the scale range
#> (`geom_line()`).


## Comparing several P(s)

contacts_yeast <- contacts_yeast()
#> see ?HiContactsData and browseVignettes('HiContactsData') for documentation
#> loading from cache
contacts_yeast_eco1 <- contacts_yeast_eco1()
#> see ?HiContactsData and browseVignettes('HiContactsData') for documentation
#> loading from cache
ps_wt <- distanceLaw(contacts_yeast)
#> pairsFile not specified. The P(s) curve will be an approximation.
ps_wt$sample <- 'WT'
ps_eco1 <- distanceLaw(contacts_yeast_eco1)
#> pairsFile not specified. The P(s) curve will be an approximation.
ps_eco1$sample <- 'eco1'
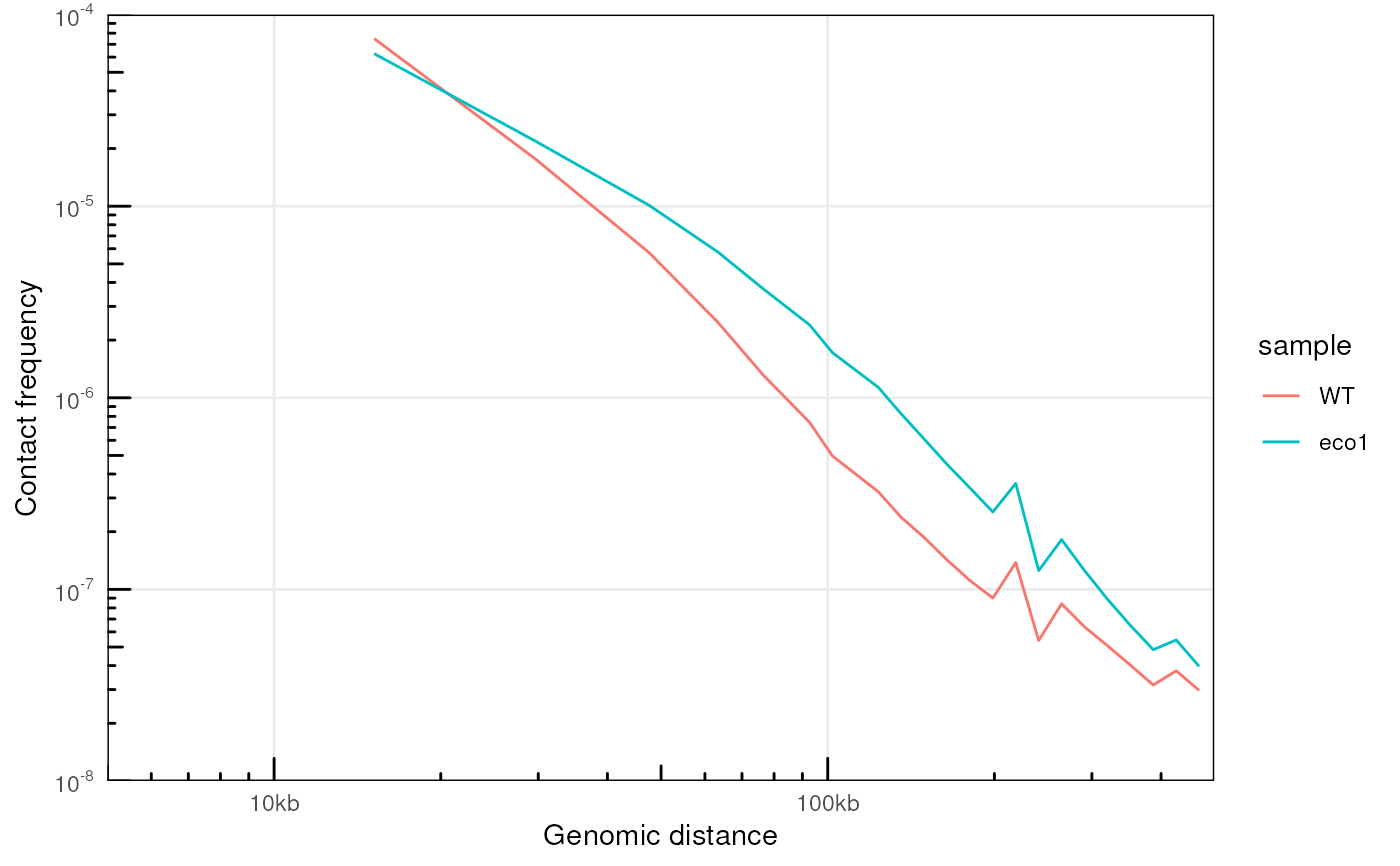
ps <- rbind(ps_wt, ps_eco1)
plotPs(ps, ggplot2::aes(x = binned_distance, y = norm_p, group = sample, color = sample))
#> Warning: Removed 26 rows containing missing values or values outside the scale range
#> (`geom_line()`).

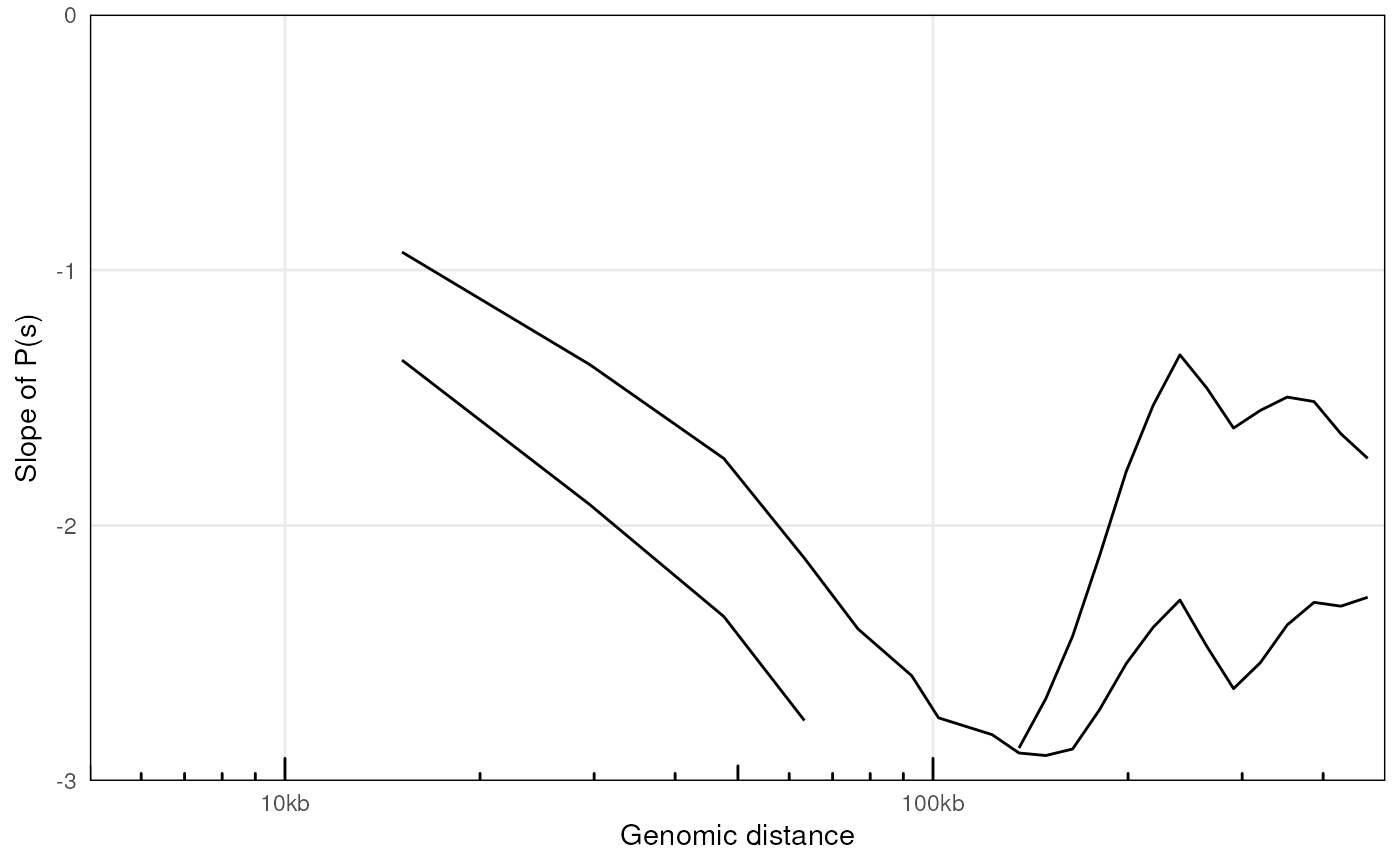
plotPsSlope(ps, ggplot2::aes(x = binned_distance, y = slope, group = sample))
#> Warning: Removed 26 rows containing missing values or values outside the scale range
#> (`geom_line()`).
