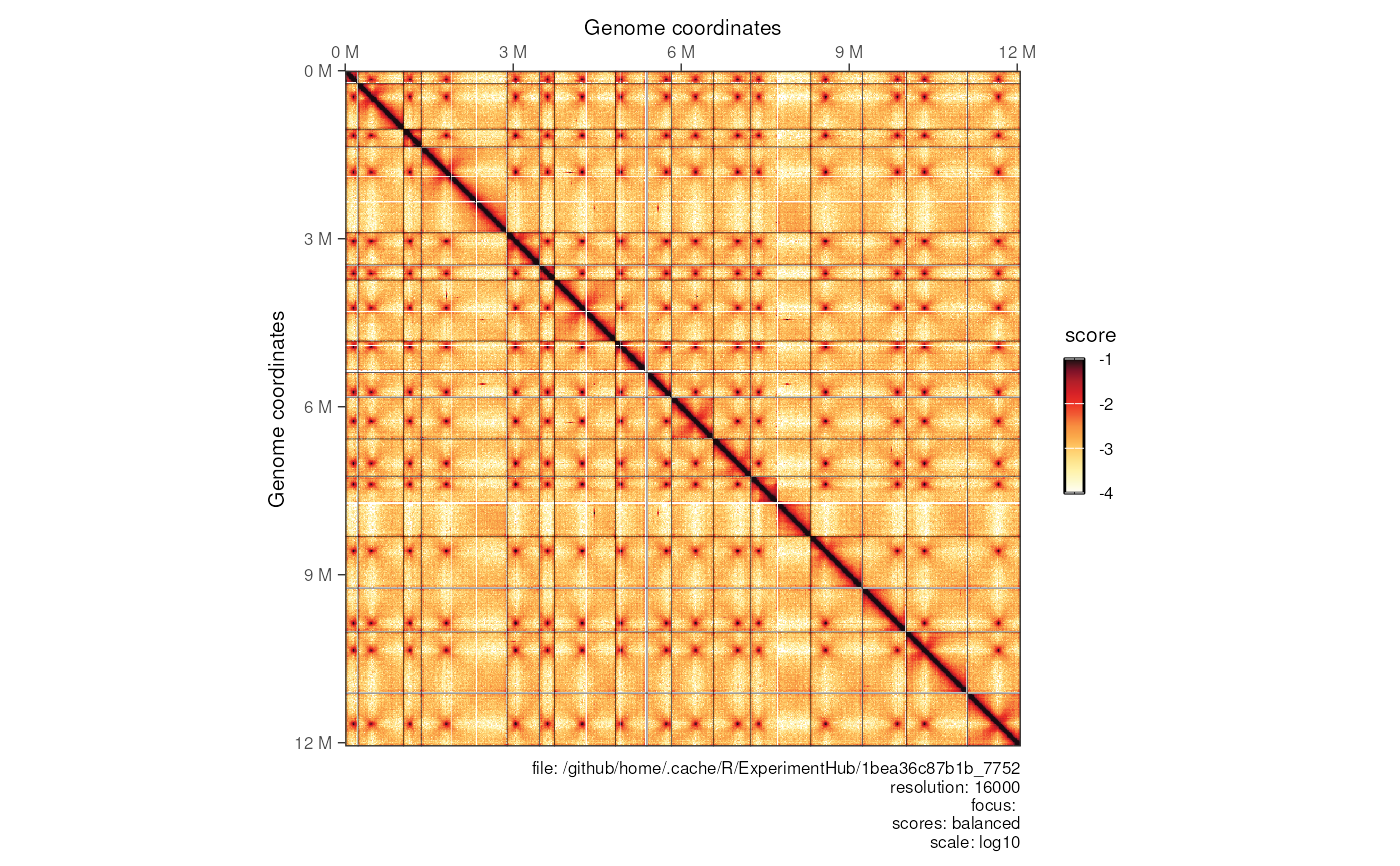
Plotting a contact matrix
plotMatrix(x, ...)

montage(x, ...)

# S4 method for class 'HiCExperiment'
plotMatrix(
  x,
  compare.to = NULL,
  use.scores = "balanced",
  scale = "log10",
  maxDistance = NULL,
  loops = NULL,
  borders = NULL,
  tracks = NULL,
  limits = NULL,
  dpi = 500,
  rasterize = TRUE,
  symmetrical = TRUE,
  chrom_lines = TRUE,
  show_grid = FALSE,
  cmap = NULL,
  caption = TRUE
)

# S4 method for class 'GInteractions'
plotMatrix(
  x,
  use.scores = NULL,
  scale = "log10",
  maxDistance = NULL,
  loops = NULL,
  borders = NULL,
  tracks = NULL,
  limits = NULL,
  dpi = 500,
  rasterize = TRUE,
  symmetrical = TRUE,
  chrom_lines = TRUE,
  show_grid = FALSE,
  cmap = NULL
)

# S4 method for class 'matrix'
plotMatrix(
  x,
  scale = "log10",
  limits = NULL,
  dpi = 500,
  rasterize = TRUE,
  cmap = NULL
)

# S4 method for class 'AggrHiCExperiment'
plotMatrix(
  x,
  use.scores = "balanced",
  scale = "log10",
  maxDistance = NULL,
  loops = NULL,
  borders = NULL,
  limits = NULL,
  dpi = 500,
  rasterize = TRUE,
  chrom_lines = TRUE,
  show_grid = FALSE,
  cmap = NULL,
  caption = TRUE
)

# S4 method for class 'AggrHiCExperiment'
montage(
  x,
  use.scores = "balanced",
  scale = "log10",
  limits = NULL,
  dpi = 500,
  rasterize = TRUE,
  cmap = NULL
)
Arguments
- x
A HiCExperiment object
- ...
Extra arguments passed to the corresponding method.
- compare.to
Compare to a second HiC matrix in the lower left corner
- use.scores
Which scores to use in the heatmap
- scale
Any of 'log10', 'log2', 'linear', 'exp0.2' (Default: 'log10')
- maxDistance
maximum distance. If provided, the heatmap is plotted horizontally
- loops
Loops to plot on top of the heatmap, provided as
GInteractions- borders
Borders to plot on top of the heatmap, provided as
GRanges- tracks
Named list of bigwig tracks imported as
Rle- limits
color map limits
- dpi
DPI to create the plot (Default: 500)
- rasterize
Whether the generated heatmap is rasterized or vectorized (Default: TRUE)
- symmetrical
Whether to enforce a symetrical heatmap (Default: TRUE)
- chrom_lines
Whether to display separating lines between chromosomes, should any be necessary (Default: TRUE)
- show_grid
Whether to display an underlying grid (Default: FALSE)
- cmap
Color scale to use. (Default: bgrColors() if limits are c(-1, 1) and coolerColors() otherwise)
- caption
Whether to display a caption (Default: TRUE)
Value
ggplot object
Examples
contacts_yeast <- contacts_yeast()
#> see ?HiContactsData and browseVignettes('HiContactsData') for documentation
#> loading from cache
plotMatrix(
    contacts_yeast,
    use.scores = 'balanced',
    scale = 'log10',
    limits = c(-4, -1)
)
