Plotting virtual 4C profiles
plot4C(x, mapping = ggplot2::aes(x = center, y = score, col = seqnames))Arguments
- x
GRanges, generally the output of
virtual4C()- mapping
aes to pass on to ggplot2 (default:
ggplot2::aes(x = center, y = score, col = seqnames))
Value
ggplot
Examples
contacts_yeast <- contacts_yeast()
#> see ?HiContactsData and browseVignettes('HiContactsData') for documentation
#> loading from cache
v4C <- virtual4C(contacts_yeast, GenomicRanges::GRanges('II:490001-510000'))
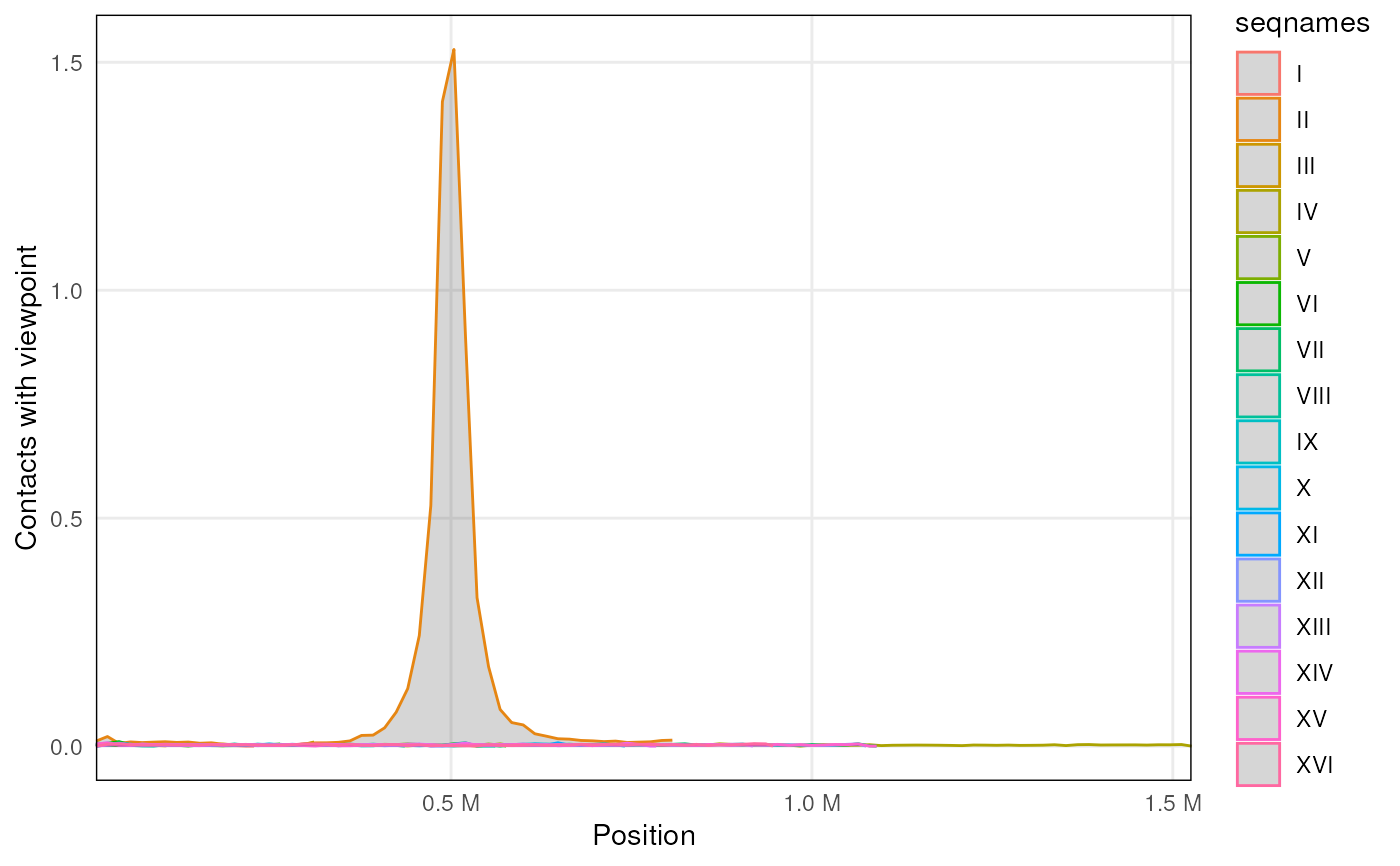
plot4C(v4C)
