# 9 Lab 5: Dimension reduction, clustering and annotation
> **NOTE:**
>
> The estimated time for this lab is around 1h20.
> **TIP:**
>
> - Learn how to perform dimension reduction on scRNAseq data
> - Understand the importance of feature selection
> - Learn how to perform clustering on scRNAseq data
> - Learn how to (automatically) annotate cells based on clustering results
## 9.1 Dimensional reduction for clustering
### 9.1.1 Preparing dataset
We will prepare scRNAseq data from a PBMC run, provided by 10X and hosted by `Bioconductor` as a package.
> **NOTE:**
>
> Which package from `Bioconductor` gives streamlined access to PBMC scRNAseq dataset from 10X Genomics?
>
> What does the object contain (type of data, number of cells, batches, organism, …)? Can you get the same data from somewhere else?
>
> > **NOTE:**
> >
> > ``` r
> > library(tidyverse)
> > ## ── Attaching core tidyverse packages ───────────────────── tidyverse 2.0.0 ──
> > ## ✔ dplyr 1.2.1 ✔ readr 2.2.0
> > ## ✔ forcats 1.0.1 ✔ stringr 1.6.0
> > ## ✔ ggplot2 4.0.3 ✔ tibble 3.3.1
> > ## ✔ lubridate 1.9.5 ✔ tidyr 1.3.2
> > ## ✔ purrr 1.2.2
> > ## ── Conflicts ─────────────────────────────────────── tidyverse_conflicts() ──
> > ## ✖ dplyr::filter() masks stats::filter()
> > ## ✖ dplyr::lag() masks stats::lag()
> > ## ℹ Use the conflicted package () to force all conflicts to become errors
> > library(SingleCellExperiment)
> > ## Loading required package: SummarizedExperiment
> > ## Loading required package: MatrixGenerics
> > ## Loading required package: matrixStats
> > ##
> > ## Attaching package: 'matrixStats'
> > ##
> > ## The following object is masked from 'package:dplyr':
> > ##
> > ## count
> > ##
> > ##
> > ## Attaching package: 'MatrixGenerics'
> > ##
> > ## The following objects are masked from 'package:matrixStats':
> > ##
> > ## colAlls, colAnyNAs, colAnys, colAvgsPerRowSet, colCollapse,
> > ## colCounts, colCummaxs, colCummins, colCumprods, colCumsums,
> > ## colDiffs, colIQRDiffs, colIQRs, colLogSumExps, colMadDiffs,
> > ## colMads, colMaxs, colMeans2, colMedians, colMins, colOrderStats,
> > ## colProds, colQuantiles, colRanges, colRanks, colSdDiffs, colSds,
> > ## colSums2, colTabulates, colVarDiffs, colVars, colWeightedMads,
> > ## colWeightedMeans, colWeightedMedians, colWeightedSds,
> > ## colWeightedVars, rowAlls, rowAnyNAs, rowAnys, rowAvgsPerColSet,
> > ## rowCollapse, rowCounts, rowCummaxs, rowCummins, rowCumprods,
> > ## rowCumsums, rowDiffs, rowIQRDiffs, rowIQRs, rowLogSumExps,
> > ## rowMadDiffs, rowMads, rowMaxs, rowMeans2, rowMedians, rowMins,
> > ## rowOrderStats, rowProds, rowQuantiles, rowRanges, rowRanks,
> > ## rowSdDiffs, rowSds, rowSums2, rowTabulates, rowVarDiffs,
> > ## rowVars, rowWeightedMads, rowWeightedMeans, rowWeightedMedians,
> > ## rowWeightedSds, rowWeightedVars
> > ##
> > ## Loading required package: GenomicRanges
> > ## Loading required package: stats4
> > ## Loading required package: BiocGenerics
> > ## Loading required package: generics
> > ##
> > ## Attaching package: 'generics'
> > ##
> > ## The following object is masked from 'package:lubridate':
> > ##
> > ## as.difftime
> > ##
> > ## The following object is masked from 'package:dplyr':
> > ##
> > ## explain
> > ##
> > ## The following objects are masked from 'package:base':
> > ##
> > ## as.difftime, as.factor, as.ordered, intersect, is.element,
> > ## setdiff, setequal, union
> > ##
> > ##
> > ## Attaching package: 'BiocGenerics'
> > ##
> > ## The following object is masked from 'package:dplyr':
> > ##
> > ## combine
> > ##
> > ## The following objects are masked from 'package:stats':
> > ##
> > ## IQR, mad, sd, var, xtabs
> > ##
> > ## The following object is masked from 'package:utils':
> > ##
> > ## data
> > ##
> > ## The following objects are masked from 'package:base':
> > ##
> > ## Filter, Find, Map, Position, Reduce, anyDuplicated, aperm,
> > ## append, as.data.frame, basename, cbind, colnames, dirname,
> > ## do.call, duplicated, eval, evalq, get, grep, grepl, is.unsorted,
> > ## lapply, mapply, match, mget, order, paste, pmax, pmax.int, pmin,
> > ## pmin.int, rank, rbind, rownames, sapply, saveRDS, scale,
> > ## sequence, table, tapply, transform, unique, unsplit, which.max,
> > ## which.min
> > ##
> > ## Loading required package: S4Vectors
> > ##
> > ## Attaching package: 'S4Vectors'
> > ##
> > ## The following objects are masked from 'package:lubridate':
> > ##
> > ## second, second<-
> > ##
> > ## The following objects are masked from 'package:dplyr':
> > ##
> > ## first, rename
> > ##
> > ## The following object is masked from 'package:tidyr':
> > ##
> > ## expand
> > ##
> > ## The following object is masked from 'package:utils':
> > ##
> > ## findMatches
> > ##
> > ## The following objects are masked from 'package:base':
> > ##
> > ## I, expand.grid, unname
> > ##
> > ## Loading required package: IRanges
> > ##
> > ## Attaching package: 'IRanges'
> > ##
> > ## The following object is masked from 'package:lubridate':
> > ##
> > ## %within%
> > ##
> > ## The following objects are masked from 'package:dplyr':
> > ##
> > ## collapse, desc, slice
> > ##
> > ## The following object is masked from 'package:purrr':
> > ##
> > ## reduce
> > ##
> > ## Loading required package: Seqinfo
> > ## Loading required package: Biobase
> > ## Welcome to Bioconductor
> > ##
> > ## Vignettes contain introductory material; view with
> > ## 'browseVignettes()'. To cite Bioconductor, see
> > ## 'citation("Biobase")', and for packages 'citation("pkgname")'.
> > ##
> > ##
> > ## Attaching package: 'Biobase'
> > ##
> > ## The following object is masked from 'package:MatrixGenerics':
> > ##
> > ## rowMedians
> > ##
> > ## The following objects are masked from 'package:matrixStats':
> > ##
> > ## anyMissing, rowMedians
> > sce <- TENxPBMCData::TENxPBMCData('pbmc4k')
> > ## OpenTelemetry error: there is no package called 'otelsdk'
> > ## Warning: replacing previous import 'BiocGenerics::version' by
> > ## 'BiocManager::version' when loading 'AnnotationHub'
> > ## OpenTelemetry error: there is no package called 'otelsdk'
> > ## see ?TENxPBMCData and browseVignettes('TENxPBMCData') for documentation
> > ## downloading 1 resources
> > ## retrieving 1 resource
> > ## loading from cache
> > rownames(sce) <- scuttle::uniquifyFeatureNames(rowData(sce)$ENSEMBL_ID, rowData(sce)$Symbol_TENx)
> > sce
> > ## class: SingleCellExperiment
> > ## dim: 33694 4340
> > ## metadata(0):
> > ## assays(1): counts
> > ## rownames(33694): RP11-34P13.3 FAM138A ... AC213203.1 FAM231B
> > ## rowData names(3): ENSEMBL_ID Symbol_TENx Symbol
> > ## colnames: NULL
> > ## colData names(11): Sample Barcode ... Individual Date_published
> > ## reducedDimNames(0):
> > ## mainExpName: NULL
> > ## altExpNames(0):
> > rowData(sce)
> > ## DataFrame with 33694 rows and 3 columns
> > ## ENSEMBL_ID Symbol_TENx Symbol
> > ##
> > ## RP11-34P13.3 ENSG00000243485 RP11-34P13.3 NA
> > ## FAM138A ENSG00000237613 FAM138A FAM138A
> > ## OR4F5 ENSG00000186092 OR4F5 OR4F5
> > ## RP11-34P13.7 ENSG00000238009 RP11-34P13.7 LOC100996442
> > ## RP11-34P13.8 ENSG00000239945 RP11-34P13.8 NA
> > ## ... ... ... ...
> > ## AC233755.2 ENSG00000277856 AC233755.2 NA
> > ## AC233755.1 ENSG00000275063 AC233755.1 LOC102723407
> > ## AC240274.1 ENSG00000271254 AC240274.1 LOC102724250
> > ## AC213203.1 ENSG00000277475 AC213203.1 NA
> > ## FAM231B ENSG00000268674 FAM231B FAM231C
> > colData(sce)
> > ## DataFrame with 4340 rows and 11 columns
> > ## Sample Barcode Sequence Library
> > ##
> > ## 1 pbmc4k AAACCTGAGAAGGCCT-1 AAACCTGAGAAGGCCT 1
> > ## 2 pbmc4k AAACCTGAGACAGACC-1 AAACCTGAGACAGACC 1
> > ## 3 pbmc4k AAACCTGAGATAGTCA-1 AAACCTGAGATAGTCA 1
> > ## 4 pbmc4k AAACCTGAGCGCCTCA-1 AAACCTGAGCGCCTCA 1
> > ## 5 pbmc4k AAACCTGAGGCATGGT-1 AAACCTGAGGCATGGT 1
> > ## ... ... ... ... ...
> > ## 4336 pbmc4k TTTGGTTTCGCTAGCG-1 TTTGGTTTCGCTAGCG 1
> > ## 4337 pbmc4k TTTGTCACACTTAACG-1 TTTGTCACACTTAACG 1
> > ## 4338 pbmc4k TTTGTCACAGGTCCAC-1 TTTGTCACAGGTCCAC 1
> > ## 4339 pbmc4k TTTGTCAGTTAAGACA-1 TTTGTCAGTTAAGACA 1
> > ## 4340 pbmc4k TTTGTCATCCCAAGAT-1 TTTGTCATCCCAAGAT 1
> > ## Cell_ranger_version Tissue_status Barcode_type Chemistry
> > ##
> > ## 1 v2.1 NA Chromium Chromium_v2
> > ## 2 v2.1 NA Chromium Chromium_v2
> > ## 3 v2.1 NA Chromium Chromium_v2
> > ## 4 v2.1 NA Chromium Chromium_v2
> > ## 5 v2.1 NA Chromium Chromium_v2
> > ## ... ... ... ... ...
> > ## 4336 v2.1 NA Chromium Chromium_v2
> > ## 4337 v2.1 NA Chromium Chromium_v2
> > ## 4338 v2.1 NA Chromium Chromium_v2
> > ## 4339 v2.1 NA Chromium Chromium_v2
> > ## 4340 v2.1 NA Chromium Chromium_v2
> > ## Sequence_platform Individual Date_published
> > ##
> > ## 1 Hiseq4000 HealthyDonor1 2017-11-08
> > ## 2 Hiseq4000 HealthyDonor1 2017-11-08
> > ## 3 Hiseq4000 HealthyDonor1 2017-11-08
> > ## 4 Hiseq4000 HealthyDonor1 2017-11-08
> > ## 5 Hiseq4000 HealthyDonor1 2017-11-08
> > ## ... ... ... ...
> > ## 4336 Hiseq4000 HealthyDonor1 2017-11-08
> > ## 4337 Hiseq4000 HealthyDonor1 2017-11-08
> > ## 4338 Hiseq4000 HealthyDonor1 2017-11-08
> > ## 4339 Hiseq4000 HealthyDonor1 2017-11-08
> > ## 4340 Hiseq4000 HealthyDonor1 2017-11-08
> > table(sce$Library)
> > ##
> > ## 1
> > ## 4340
> > ```
> >
> > The counts are stored on disk, in a `HDF5` file (this is what the `DelayedMatrix` class means): this is great to work with datasets which do not fit in memory, but it is slower than working with an in-memory matrix. This dataset is small enough to be loaded in memory, as a sparse matrix:
> >
> > ``` r
> > counts(sce)
> > ## <33694 x 4340> sparse DelayedMatrix object of type "integer":
> > ## [,1] [,2] [,3] [,4] ... [,4337] [,4338] [,4339]
> > ## RP11-34P13.3 0 0 0 0 . 0 0 0
> > ## FAM138A 0 0 0 0 . 0 0 0
> > ## OR4F5 0 0 0 0 . 0 0 0
> > ## RP11-34P13.7 0 0 0 0 . 0 0 0
> > ## RP11-34P13.8 0 0 0 0 . 0 0 0
> > ## ... . . . . . . . .
> > ## AC233755.2 0 0 0 0 . 0 0 0
> > ## AC233755.1 0 0 0 0 . 0 0 0
> > ## AC240274.1 0 0 0 0 . 0 0 0
> > ## AC213203.1 0 0 0 0 . 0 0 0
> > ## FAM231B 0 0 0 0 . 0 0 0
> > ## [,4340]
> > ## RP11-34P13.3 0
> > ## FAM138A 0
> > ## OR4F5 0
> > ## RP11-34P13.7 0
> > ## RP11-34P13.8 0
> > ## ... .
> > ## AC233755.2 0
> > ## AC233755.1 0
> > ## AC240274.1 0
> > ## AC213203.1 0
> > ## FAM231B 0
> > counts(sce) <- as(counts(sce), 'dgCMatrix')
> > counts(sce)[1:10, 1:10]
> > ## 10 x 10 sparse Matrix of class "dgCMatrix"
> > ##
> > ## RP11-34P13.3 . . . . . . . . . .
> > ## FAM138A . . . . . . . . . .
> > ## OR4F5 . . . . . . . . . .
> > ## RP11-34P13.7 . . . . . . . . . .
> > ## RP11-34P13.8 . . . . . . . . . .
> > ## RP11-34P13.14 . . . . . . . . . .
> > ## RP11-34P13.9 . . . . . . . . . .
> > ## FO538757.3 . . . . . . . . . .
> > ## FO538757.2 . . . . . . . . . 1
> > ## AP006222.2 . . . . . . . . . .
> > ```
### 9.1.2 Normalize counts using `scran`
Just like in bulk high-throughput sequencing experiments, scRNAseq counts have to be normalized to the sequencing depth for each cell. We can define the library size as the total sum of counts across all genes for each cell, the expected value of which is assumed to scale with any cell-specific biases. However, this relies on the assumption that within the entire dataset, most genes are non-differentially expressed and expressed roughly within the same range. Depending on the set up of the scRNAseq experiment, this can be entirely false. To avoid relying on this hypothesis, we can (1) quickly pre-cluster cells, then (2) normalize cells using their library size factor separately in each cluster, then (3) rescaling size factors so that they are comparable across clusters.
All of this can be done very simply using the combo `quickCluster() + computeSumFactors()` from the `scran` package, followed by `normalizeRnaCounts.se()` from the `scrapper` package.
> **NOTE:**
>
> What is the purpose of the `quickCluster()` function? What does it return?
>
> What is the purpose of the `computeSumFactors()` function? What does it return?
>
> What is the purpose of the `normalizeRnaCounts.se()` function? What does it return?
>
> > **NOTE:**
> >
> > ``` r
> > set.seed(1000)
> > clusters <- scran::quickCluster(sce)
> > table(clusters)
> > ## clusters
> > ## 1 2 3 4 5 6 7 8 9 10 11
> > ## 588 361 264 161 866 365 531 536 360 207 101
> > sce <- scran::computeSumFactors(sce, cluster = clusters)
> > colData(sce)
> > ## DataFrame with 4340 rows and 12 columns
> > ## Sample Barcode Sequence Library
> > ##
> > ## 1 pbmc4k AAACCTGAGAAGGCCT-1 AAACCTGAGAAGGCCT 1
> > ## 2 pbmc4k AAACCTGAGACAGACC-1 AAACCTGAGACAGACC 1
> > ## 3 pbmc4k AAACCTGAGATAGTCA-1 AAACCTGAGATAGTCA 1
> > ## 4 pbmc4k AAACCTGAGCGCCTCA-1 AAACCTGAGCGCCTCA 1
> > ## 5 pbmc4k AAACCTGAGGCATGGT-1 AAACCTGAGGCATGGT 1
> > ## ... ... ... ... ...
> > ## 4336 pbmc4k TTTGGTTTCGCTAGCG-1 TTTGGTTTCGCTAGCG 1
> > ## 4337 pbmc4k TTTGTCACACTTAACG-1 TTTGTCACACTTAACG 1
> > ## 4338 pbmc4k TTTGTCACAGGTCCAC-1 TTTGTCACAGGTCCAC 1
> > ## 4339 pbmc4k TTTGTCAGTTAAGACA-1 TTTGTCAGTTAAGACA 1
> > ## 4340 pbmc4k TTTGTCATCCCAAGAT-1 TTTGTCATCCCAAGAT 1
> > ## Cell_ranger_version Tissue_status Barcode_type Chemistry
> > ##
> > ## 1 v2.1 NA Chromium Chromium_v2
> > ## 2 v2.1 NA Chromium Chromium_v2
> > ## 3 v2.1 NA Chromium Chromium_v2
> > ## 4 v2.1 NA Chromium Chromium_v2
> > ## 5 v2.1 NA Chromium Chromium_v2
> > ## ... ... ... ... ...
> > ## 4336 v2.1 NA Chromium Chromium_v2
> > ## 4337 v2.1 NA Chromium Chromium_v2
> > ## 4338 v2.1 NA Chromium Chromium_v2
> > ## 4339 v2.1 NA Chromium Chromium_v2
> > ## 4340 v2.1 NA Chromium Chromium_v2
> > ## Sequence_platform Individual Date_published sizeFactor
> > ##
> > ## 1 Hiseq4000 HealthyDonor1 2017-11-08 0.403246
> > ## 2 Hiseq4000 HealthyDonor1 2017-11-08 0.739777
> > ## 3 Hiseq4000 HealthyDonor1 2017-11-08 0.429493
> > ## 4 Hiseq4000 HealthyDonor1 2017-11-08 0.527001
> > ## 5 Hiseq4000 HealthyDonor1 2017-11-08 0.600344
> > ## ... ... ... ... ...
> > ## 4336 Hiseq4000 HealthyDonor1 2017-11-08 1.422566
> > ## 4337 Hiseq4000 HealthyDonor1 2017-11-08 0.947146
> > ## 4338 Hiseq4000 HealthyDonor1 2017-11-08 1.962193
> > ## 4339 Hiseq4000 HealthyDonor1 2017-11-08 0.615199
> > ## 4340 Hiseq4000 HealthyDonor1 2017-11-08 0.771550
> > summary(sizeFactors(sce))
> > ## Min. 1st Qu. Median Mean 3rd Qu. Max.
> > ## 0.2287 0.6949 0.8721 1.0000 1.1117 12.1761
> > sce <- scrapper::normalizeRnaCounts.se(sce, size.factors = sizeFactors(sce))
> > assays(sce)
> > ## List of length 2
> > ## names(2): counts logcounts
> > logcounts(sce)
> > ## <33694 x 4340> sparse LogNormalizedMatrix object of type "double":
> > ## [,1] [,2] [,3] ... [,4339] [,4340]
> > ## RP11-34P13.3 0 0 0 . 0 0
> > ## FAM138A 0 0 0 . 0 0
> > ## OR4F5 0 0 0 . 0 0
> > ## RP11-34P13.7 0 0 0 . 0 0
> > ## RP11-34P13.8 0 0 0 . 0 0
> > ## ... . . . . . .
> > ## AC233755.2 0 0 0 . 0 0
> > ## AC233755.1 0 0 0 . 0 0
> > ## AC240274.1 0 0 0 . 0 0
> > ## AC213203.1 0 0 0 . 0 0
> > ## FAM231B 0 0 0 . 0 0
> > ```
> >
> > `normalizeRnaCounts.se()` divides the counts of each cell by its size factor, then log-transforms them (`log2(x + 1)`). Note that the `logcounts` assay is not a regular matrix: it is a `LogNormalizedMatrix`, which only stores the counts and the size factors, and computes the log-normalized values on the fly. This saves a lot of memory for large datasets!
### 9.1.3 Feature selection
We often use scRNAseq data in exploratory analyses to characterize heterogeneity across cells. Procedures like clustering and dimensionality reduction compare cells based on their gene expression profiles. The choice of genes to include in this comparison may have a major impact on the performance of downstream methods. Ideally, one wants to only select genes that contain useful information about the biology of the system while removing genes that contain random noise. This aims to preserve interesting biological structure without the variance that obscures that structure.
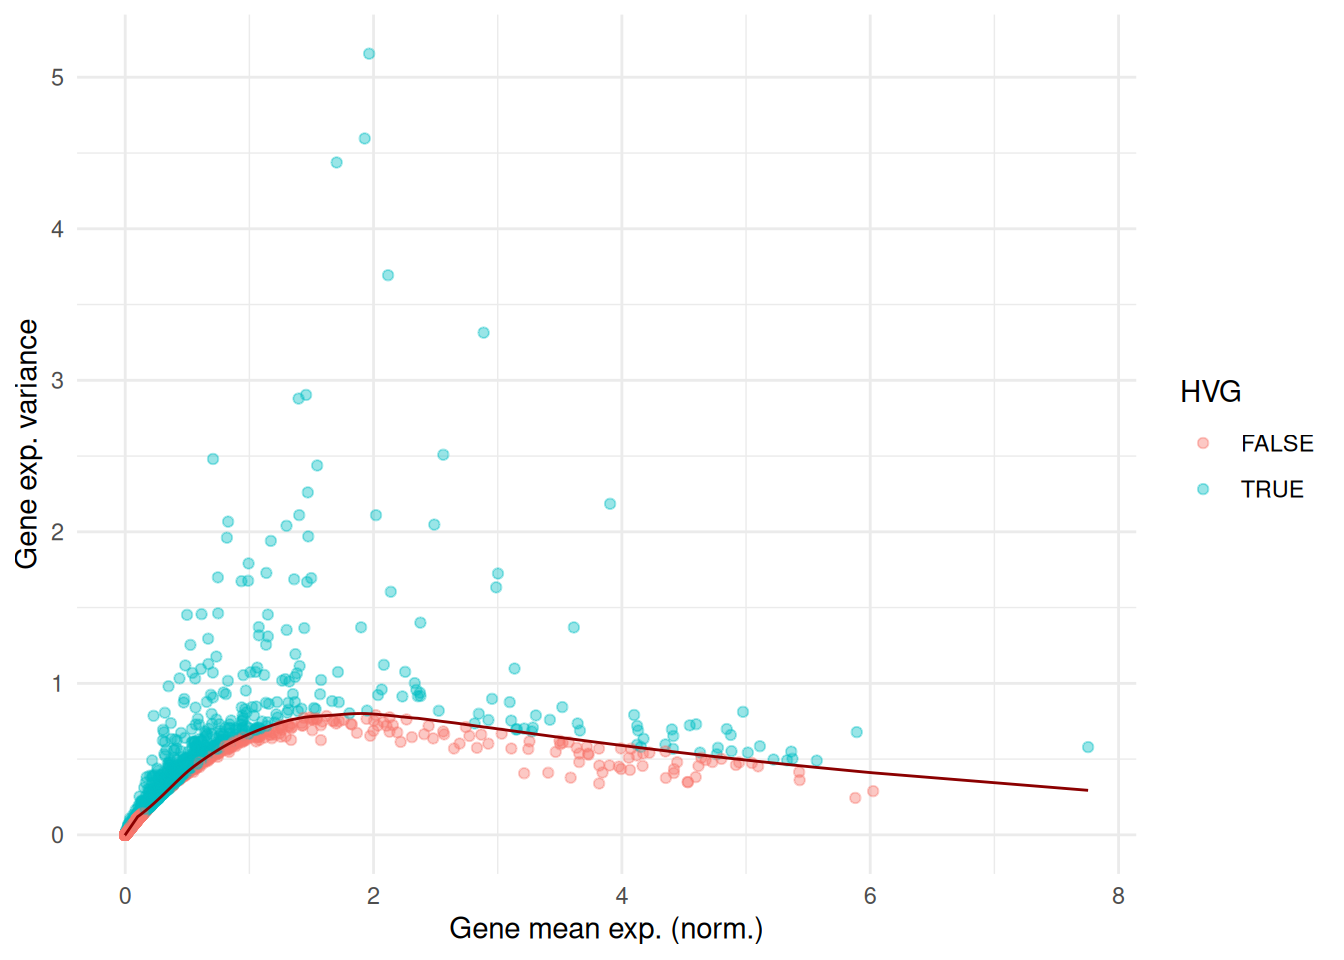
The simplest approach to feature selection is to compute the variance of the log-normalized expression values, to select the most variable genes. Modelling of the mean-variance relationship can be achieved by the `modelGeneVariances()` function from the `scrapper` package: it computes the mean and the variance of the log-normalized expression of each gene, fits a trend to the variance with respect to the mean (the *technical* variance), and computes the residual from this trend for each gene (the *biological* variance).
> **NOTE:**
>
> Apply the `modelGeneVariances()` function to the normalized counts. What does the returned object contain?
>
> > **NOTE:**
> >
> > ``` r
> > gene_variances <- scrapper::modelGeneVariances(logcounts(sce))
> > names(gene_variances)
> > ## [1] "statistics"
> > gene_variances$statistics
> > ## DataFrame with 33694 rows and 4 columns
> > ## means variances fitted residuals
> > ##
> > ## RP11-34P13.3 0.000000000 0.000000000 0.000000000 0.000000000
> > ## FAM138A 0.000000000 0.000000000 0.000000000 0.000000000
> > ## OR4F5 0.000000000 0.000000000 0.000000000 0.000000000
> > ## RP11-34P13.7 0.001973297 0.002003373 0.002357441 -0.000354068
> > ## RP11-34P13.8 0.000491705 0.000531807 0.000587426 -0.000055619
> > ## ... ... ... ... ...
> > ## AC233755.2 0.00000000 0.0000000 0.00000 0.000000000
> > ## AC233755.1 0.00000000 0.0000000 0.00000 0.000000000
> > ## AC240274.1 0.00961767 0.0112683 0.01149 -0.000221649
> > ## AC213203.1 0.00000000 0.0000000 0.00000 0.000000000
> > ## FAM231B 0.00000000 0.0000000 0.00000 0.000000000
> > ```
>
> Identify the top 10% most variable genes from this object.
>
> > **NOTE:**
> >
> > ``` r
> > HVGs_idx <- scrapper::chooseHighlyVariableGenes(
> > gene_variances$statistics$residuals,
> > top = round(0.1 * nrow(sce))
> > )
> > HVGs <- rownames(sce)[HVGs_idx]
> > rowData(sce)$isHVG <- rownames(sce) %in% HVGs
> > head(rowData(sce))
> > ## DataFrame with 6 rows and 4 columns
> > ## ENSEMBL_ID Symbol_TENx Symbol isHVG
> > ##
> > ## RP11-34P13.3 ENSG00000243485 RP11-34P13.3 NA FALSE
> > ## FAM138A ENSG00000237613 FAM138A FAM138A FALSE
> > ## OR4F5 ENSG00000186092 OR4F5 OR4F5 FALSE
> > ## RP11-34P13.7 ENSG00000238009 RP11-34P13.7 LOC100996442 FALSE
> > ## RP11-34P13.8 ENSG00000239945 RP11-34P13.8 NA FALSE
> > ## RP11-34P13.14 ENSG00000239906 RP11-34P13.14 NA FALSE
> > table(rowData(sce)$isHVG)
> > ##
> > ## FALSE TRUE
> > ## 30325 3369
> > ```
> >
> > [`scrapper::chooseRnaHvgs.se()`](https://rdrr.io/pkg/scrapper/man/chooseRnaHvgs.se.html) performs both steps at once, and stores the results in the [`rowData()`](https://rdrr.io/pkg/SummarizedExperiment/man/SummarizedExperiment-class.html) of the `SingleCellExperiment` object.
>
> Visualize the mean-variance fit of the data, coloring points by whether they are in the top 10% most variable genes.
>
> > **NOTE:**
> >
> > ``` r
> > df <- tibble(
> > mean = gene_variances$statistics$means,
> > var = gene_variances$statistics$variances,
> > trend = gene_variances$statistics$fitted,
> > HVG = rowData(sce)$isHVG
> > )
> > ggplot(df) +
> > geom_point(aes(x = mean, y = var, col = HVG), alpha = 0.4) +
> > geom_line(aes(x = mean, y = trend), col = 'darkred') +
> > theme_minimal() +
> > labs(x = 'Gene mean exp. (norm.)', y = 'Gene exp. variance')
> > ```
> >
> > 
### 9.1.4 PCA on filtered dataset
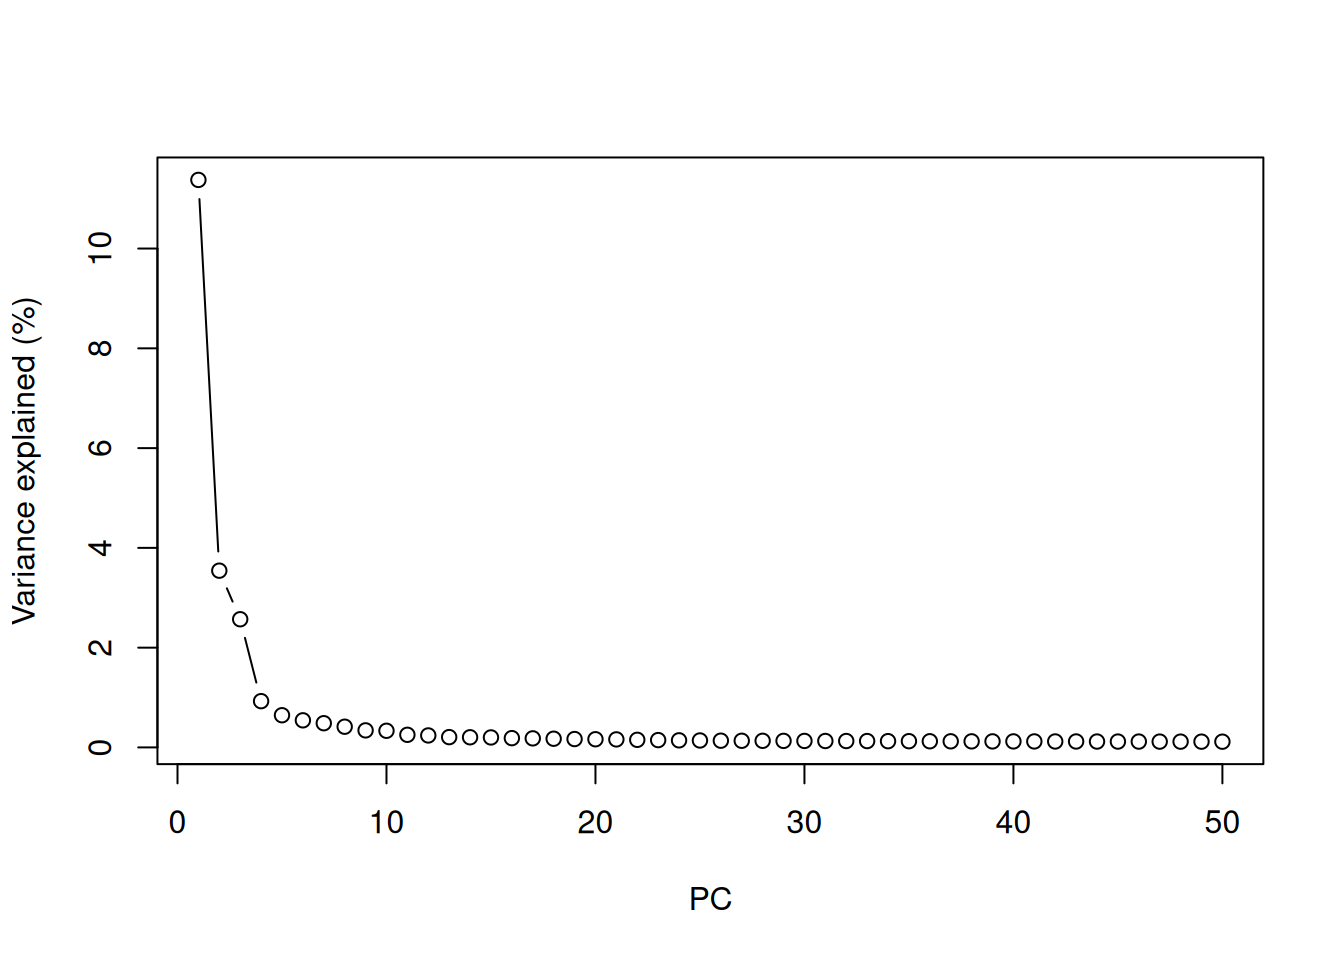
We now have normalized counts filtered for the top 10% genes varying with the greatest biological significance. Still, that represents a ~3,400 x nCells (~4,300) dataset (each row being a feature). This is still too big to reliably use in standard clustering approaches. We can further compress the dataset. The most widely used approach is `PCA`: it computes a small number of “components” (typically 5-50) optimally summarizing the variability of the whole dataset, while retaining linearity of the underlying numerical data and being computationallt quite efficient.
> **NOTE:**
>
> Use the `runPca.se()` function from the `scrapper` package to compute a `PCA` embedding of the data, using the highly variable genes only.
>
> How much of the variance is explained by each principal component? How many components would you keep for downstream analyses?
>
> > **NOTE:**
> >
> > ``` r
> > set.seed(1000)
> > sce <- scrapper::runPca.se(sce, features = rowData(sce)$isHVG, number = 50)
> > reducedDim(sce, 'PCA')[1:5, 1:5]
> > ## PC1 PC2 PC3 PC4 PC5
> > ## [1,] 16.874448 0.8689463 -1.0040325 4.6334941 1.75547776
> > ## [2,] 16.334695 1.7263185 -3.9471546 2.2686646 0.04918039
> > ## [3,] 19.328208 2.2938734 2.1556838 4.7900223 -3.00881519
> > ## [4,] -6.381954 2.8499857 0.3208111 0.2344315 3.75205924
> > ## [5,] -8.227185 1.5069442 -5.0113033 1.6077754 0.83386219
> > percent_var <- metadata(sce)$PCA$variance.explained / metadata(sce)$PCA$total.variance * 100
> > plot(percent_var, xlab = 'PC', ylab = 'Variance explained (%)', type = 'b')
> > ```
> >
> > 
> >
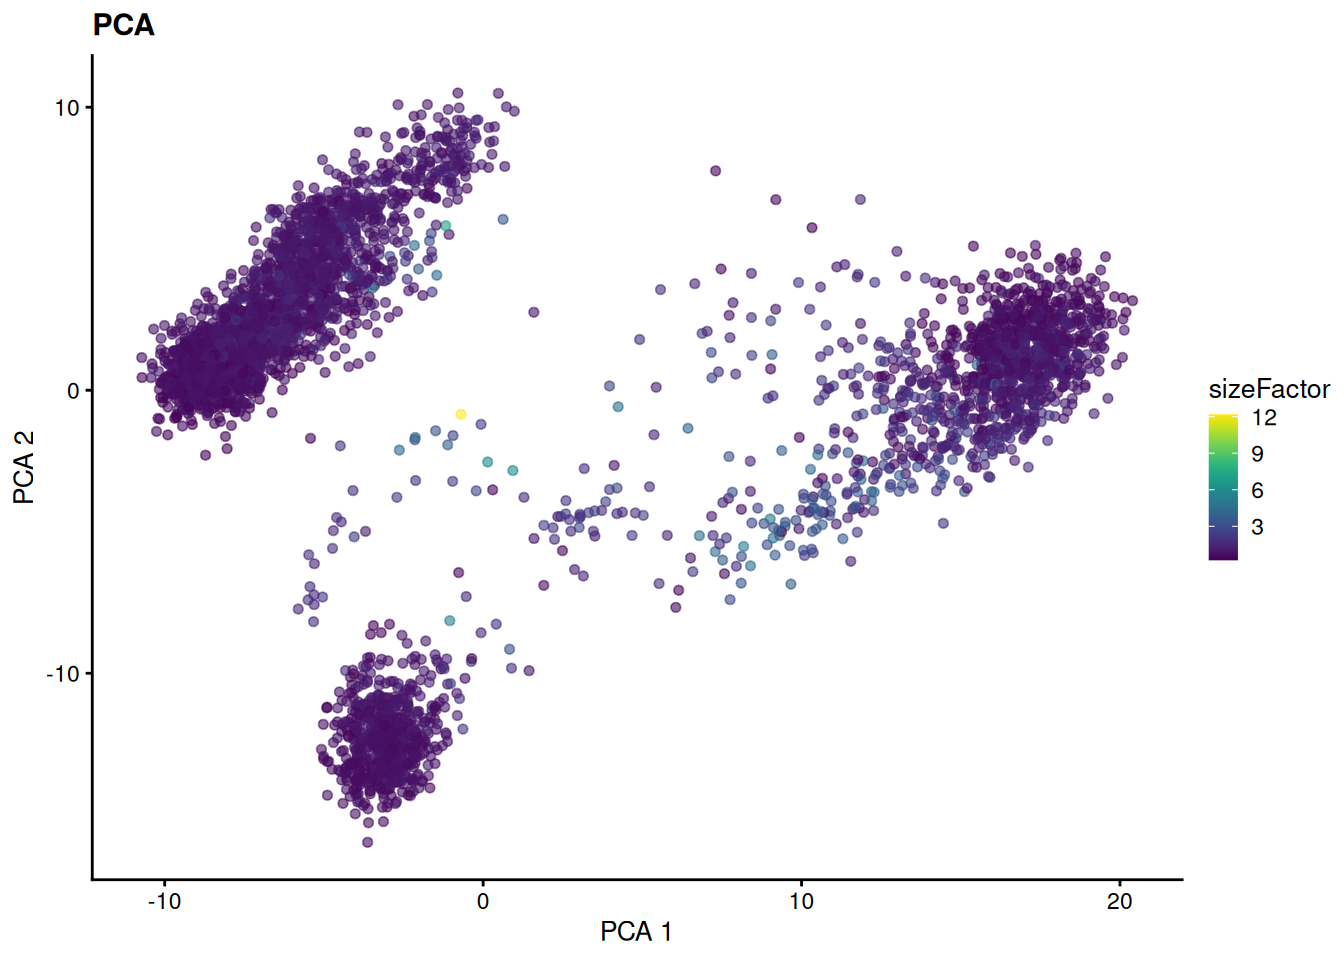
> > The “elbow” of this curve suggests that the first ~15 PCs capture most of the biological signal, and that the next ones mostly capture noise. We keep the first 15 PCs for downstream analyses:
> >
> > ``` r
> > reducedDim(sce, 'PCA') <- reducedDim(sce, 'PCA')[, 1:15]
> > p <- scater::plotReducedDim(sce, 'PCA', colour_by = 'sizeFactor') + ggtitle('PCA')
> > p
> > ```
> >
> > 
## 9.2 Clustering
Clustering is an unsupervised learning procedure that is used in scRNA-seq data analysis to empirically define groups of cells with similar expression profiles. Its primary purpose is to summarize the data in a digestible format for human interpretation.
After annotation based on marker genes, the clusters can be treated as proxies for more abstract biological concepts such as cell types or states. Clustering is thus a critical step for extracting biological insights from scRNA-seq data.
### 9.2.1 Clustering algorithms
Three main approaches can be used:
1. Hierarchical clustering
2. k-means clustering
3. Graph-based clustering
Today, we will focus on graph-based clustering, as it is becoming the standard for scRNAseq: it is a flexible and scalable technique for clustering even the largest scRNA-seq datasets. We first build a graph where each node is a cell that is connected by edges to its nearest neighbors in the high-dimensional space. Edges are weighted based on the similarity between the cells involved, with higher weight given to cells that are more closely related.
> **NOTE:**
>
> Compute a graph-based clustering of the PBMC dataset.
>
> > **NOTE:**
> >
> > ``` r
> > set.seed(1000)
> > graph <- bluster::makeSNNGraph(reducedDim(sce, 'PCA'), k = 5)
> > graph
> > ## IGRAPH c91ffbc U-W- 4340 68716 --
> > ## + attr: weight (e/n)
> > ## + edges from c91ffbc:
> > ## [1] 6-- 16 6-- 21 6-- 22 4-- 23 12-- 25 1-- 26 12-- 28 23-- 32
> > ## [9] 15-- 35 14-- 36 32-- 48 18-- 52 6-- 53 16-- 53 47-- 54 52-- 55
> > ## [17] 49-- 55 26-- 55 2-- 57 27-- 58 7-- 61 15-- 64 39-- 67 31-- 67
> > ## [25] 21-- 69 27-- 70 58-- 70 27-- 72 70-- 72 58-- 72 65-- 77 68-- 79
> > ## [33] 71-- 84 46-- 85 3-- 85 35-- 88 15-- 88 28-- 90 12-- 90 12-- 91
> > ## [41] 25-- 91 28-- 91 90-- 91 15-- 97 35-- 97 88-- 97 74-- 99 61--101
> > ## [49] 7--101 54--102 33--102 13--102 56--104 92--105 51--106 105--106
> > ## [57] 2--107 55--107 34--108 68--109 100--114 12--116 69--116 67--120
> > ## + ... omitted several edges
> > sce_clust <- igraph::cluster_louvain(graph)$membership
> > sce$clusters_graph <- factor(sce_clust)
> > table(sce$clusters_graph)
> > ##
> > ## 1 2 3 4 5 6 7 8 9 10 11 12 13 14 15
> > ## 883 456 910 37 130 377 530 216 192 133 158 252 10 17 39
> > ```
> >
> > The same can be achieved in a single step with [`scrapper::clusterGraph.se()`](https://rdrr.io/pkg/scrapper/man/clusterGraph.se.html), which builds the shared nearest-neighbor graph from the `PCA` embedding and clusters it with the “multilevel” (a.k.a. Louvain) algorithm:
> >
> > ``` r
> > sce <- scrapper::clusterGraph.se(sce, num.neighbors = 5, method = "multilevel")
> > table(sce$clusters)
> > ##
> > ## 1 2 3 4 5 6 7 8 9 10 11 12 13 14 15 16 17
> > ## 566 375 939 143 37 130 374 22 417 219 192 195 97 331 178 87 38
> > table(sce$clusters_graph, sce$clusters)
> > ##
> > ## 1 2 3 4 5 6 7 8 9 10 11 12 13 14 15 16 17
> > ## 1 566 0 0 0 0 0 0 22 0 0 0 0 1 294 0 0 0
> > ## 2 0 359 43 51 0 0 0 0 1 0 0 2 0 0 0 0 0
> > ## 3 0 0 892 0 0 0 0 0 0 0 0 0 0 0 1 17 0
> > ## 4 0 0 0 0 37 0 0 0 0 0 0 0 0 0 0 0 0
> > ## 5 0 0 0 0 0 130 0 0 0 0 0 0 0 0 0 0 0
> > ## 6 0 0 0 0 0 0 372 0 0 5 0 0 0 0 0 0 0
> > ## 7 0 3 0 73 0 0 0 0 416 0 0 38 0 0 0 0 0
> > ## 8 0 0 0 0 0 0 2 0 0 214 0 0 0 0 0 0 0
> > ## 9 0 0 0 0 0 0 0 0 0 0 192 0 0 0 0 0 0
> > ## 10 0 0 0 0 0 0 0 0 0 0 0 0 96 37 0 0 0
> > ## 11 0 2 1 1 0 0 0 0 0 0 0 153 0 0 1 0 0
> > ## 12 0 1 2 1 0 0 0 0 0 0 0 2 0 0 176 70 0
> > ## 13 0 10 0 0 0 0 0 0 0 0 0 0 0 0 0 0 0
> > ## 14 0 0 0 17 0 0 0 0 0 0 0 0 0 0 0 0 0
> > ## 15 0 0 1 0 0 0 0 0 0 0 0 0 0 0 0 0 38
> > ```
> **NOTE:**
>
> What are the main parameters to choose when building the graph? How do they impact the clustering?
>
> > **NOTE:**
> >
> > ``` r
> > set.seed(1000)
> > graph2 <- bluster::makeSNNGraph(reducedDim(sce, 'PCA'), k = 50)
> > sce_clust2 <- igraph::cluster_louvain(graph2)$membership
> > table(sce_clust, sce_clust2)
> > ## sce_clust2
> > ## sce_clust 1 2 3 4 5 6 7 8
> > ## 1 879 0 0 0 2 0 2 0
> > ## 2 0 365 80 0 0 11 0 0
> > ## 3 0 4 906 0 0 0 0 0
> > ## 4 0 0 0 36 1 0 0 0
> > ## 5 15 0 0 115 0 0 0 0
> > ## 6 0 0 0 0 377 0 0 0
> > ## 7 0 4 0 0 0 526 0 0
> > ## 8 0 0 0 0 216 0 0 0
> > ## 9 0 0 0 0 1 21 170 0
> > ## 10 21 0 0 0 0 0 0 112
> > ## 11 0 132 2 0 0 24 0 0
> > ## 12 0 182 70 0 0 0 0 0
> > ## 13 0 6 2 1 0 1 0 0
> > ## 14 0 0 0 0 16 1 0 0
> > ## 15 38 0 1 0 0 0 0 0
> > ```
### 9.2.2 Dimensional reduction for clustering visualization
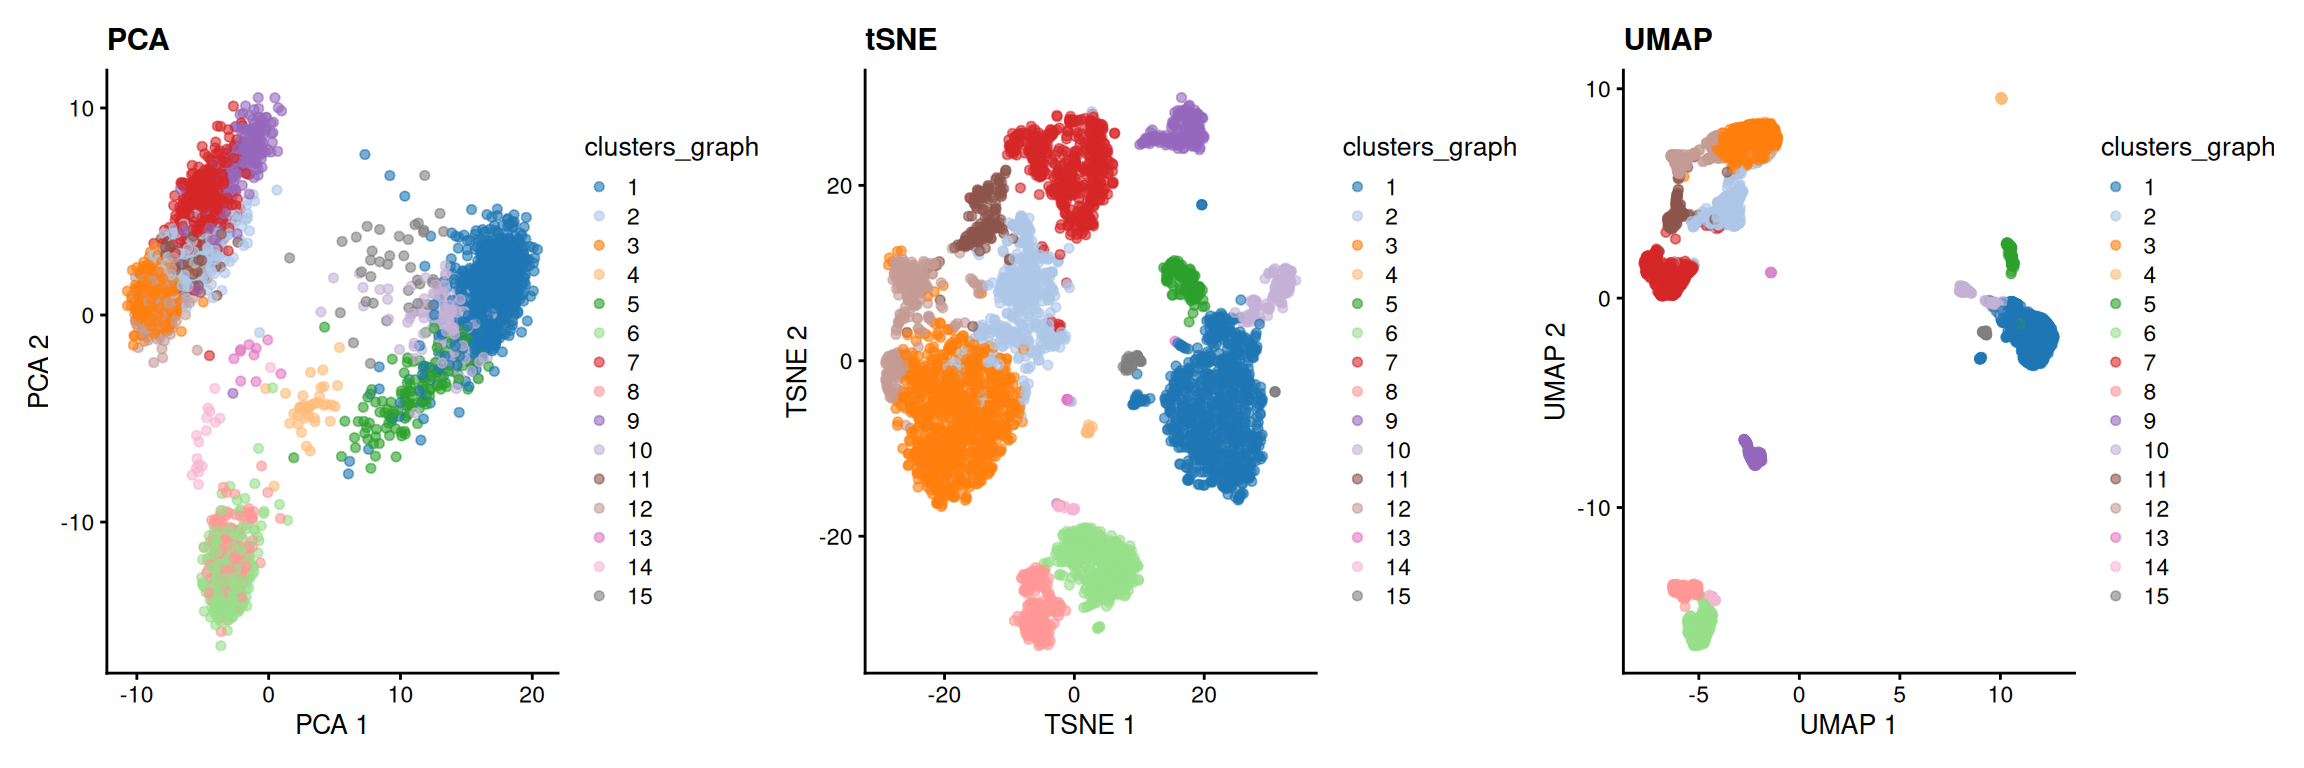
`PCA` is a powerful linear approach to compress large datasets into smaller dimensional spaces. However, it struggles at emphasizing the existence of clusters in complex datasets, when visualized in 2D.
`scater` (and `scrapper`, with `runTsne.se()` and `runUmap.se()`) provides a handy way to perform more complex data embeddings:
- tSNE
- UMAP
- Diffusion Map
- Multi-Dimensional Scaling (MDS)
- Non-negative Matrix Factorization (NMF)
> **NOTE:**
>
> Explore the different dimensional reduction algorithms, trying different hyperparameters combinations.
>
> When you run these commands, pay attention to how long each command takes to run! While this run, check the `Help` page for each function (e.g. `?runTSNE`)
>
> > **NOTE:**
> >
> > ``` r
> > set.seed(1000)
> > reducedDims(sce)
> > ## List of length 1
> > ## names(1): PCA
> > sce <- scater::runTSNE(sce, dimred = 'PCA')
> > sce <- scater::runUMAP(sce, dimred = 'PCA')
> > reducedDims(sce)
> > ## List of length 3
> > ## names(3): PCA TSNE UMAP
> > reducedDim(sce, 'UMAP')[1:10, ]
> > ## UMAP1 UMAP2
> > ## [1,] 11.249780 -2.899521
> > ## [2,] 11.692815 -2.042597
> > ## [3,] 11.768314 -3.106799
> > ## [4,] -3.842811 3.897236
> > ## [5,] -3.010130 7.146582
> > ## [6,] -2.798562 5.125863
> > ## [7,] 10.040070 9.562628
> > ## [8,] 10.458092 2.492838
> > ## [9,] -5.173162 -15.649355
> > ## [10,] 9.038997 -2.854003
> > ```
> **NOTE:**
>
> Use the [`scater::plotReducedDim()`](https://rdrr.io/pkg/scater/man/plotReducedDim.html) function to plot cells in each embedding. Comment.
>
> > **NOTE:**
> >
> > ``` r
> > library(patchwork)
> > p <- scater::plotReducedDim(sce, 'PCA', colour_by = 'clusters_graph') + ggtitle('PCA') +
> > scater::plotReducedDim(sce, 'TSNE', colour_by = 'clusters_graph') + ggtitle('tSNE') +
> > scater::plotReducedDim(sce, 'UMAP', colour_by = 'clusters_graph') + ggtitle('UMAP')
> > p
> > ```
> >
> > 
### 9.2.3 [BONUS](#bonus) For the pros of clustering… Compare different clustering approaches
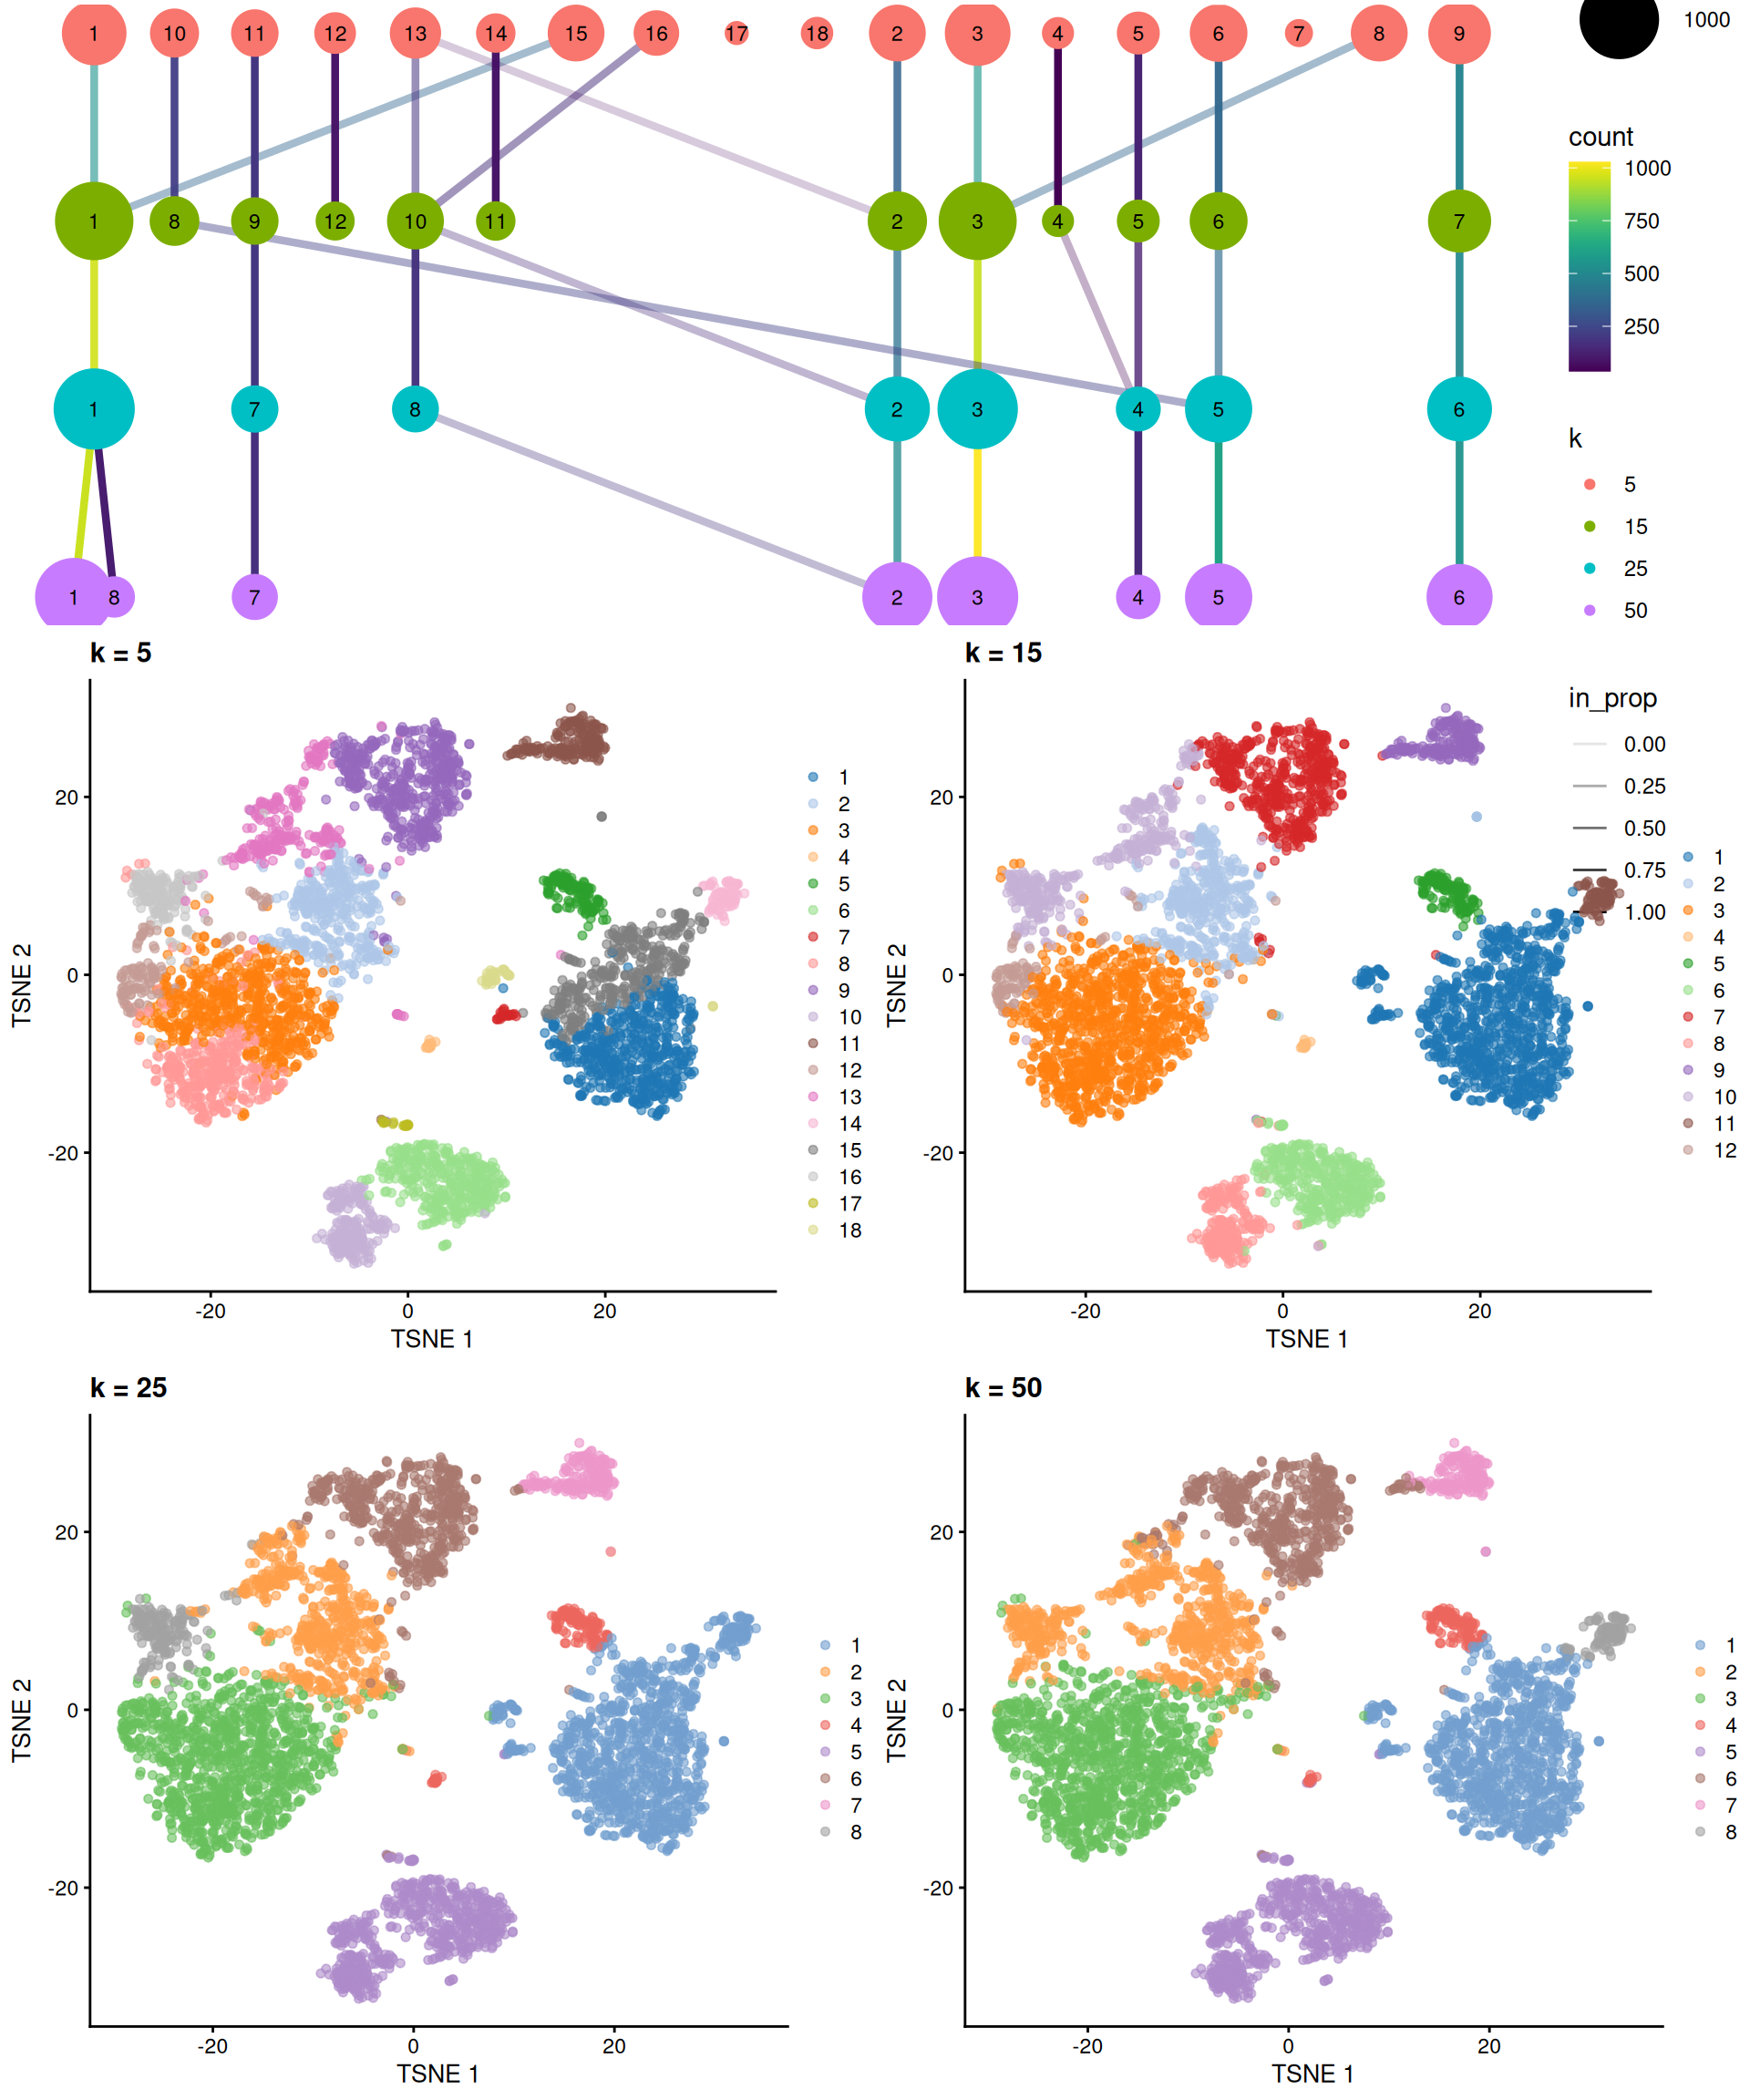
Leveraging the `bluster` package, different clustering approaches can be performed using a uniformed syntax, to compare their output.
> **NOTE:**
>
> Using `clusterSweep()`, compare the effect of different `k` neighbor values when performing graph-based clustering.
>
> > **NOTE:**
> >
> > ``` r
> > set.seed(1000)
> > clusters <- bluster::clusterSweep(
> > reducedDim(sce, 'PCA'),
> > BLUSPARAM = bluster::SNNGraphParam(),
> > k = c(5L, 15L, 25L, 50L),
> > cluster.fun = c("louvain")
> > )
> > colnames(clusters$clusters)
> > ## [1] "k.5_cluster.fun.louvain" "k.15_cluster.fun.louvain"
> > ## [3] "k.25_cluster.fun.louvain" "k.50_cluster.fun.louvain"
> > head(clusters$clusters)
> > ## DataFrame with 6 rows and 4 columns
> > ## k.5_cluster.fun.louvain k.15_cluster.fun.louvain k.25_cluster.fun.louvain
> > ##
> > ## 1 1 1 1
> > ## 2 1 1 1
> > ## 3 1 1 1
> > ## 4 2 2 2
> > ## 5 3 3 3
> > ## 6 2 3 3
> > ## k.50_cluster.fun.louvain
> > ##
> > ## 1 1
> > ## 2 1
> > ## 3 1
> > ## 4 2
> > ## 5 3
> > ## 6 3
> > clusters$parameters
> > ## DataFrame with 4 rows and 2 columns
> > ## k cluster.fun
> > ##
> > ## k.5_cluster.fun.louvain 5 louvain
> > ## k.15_cluster.fun.louvain 15 louvain
> > ## k.25_cluster.fun.louvain 25 louvain
> > ## k.50_cluster.fun.louvain 50 louvain
> > library(ggraph)
> > p <- cowplot::plot_grid(
> > clustree::clustree(
> > as.data.frame(clusters$clusters) |> setNames(paste0('k', c(5, 15, 25, 50))),
> > prefix = 'k',
> > edge_arrow = FALSE
> > ),
> > cowplot::plot_grid(
> > scater::plotReducedDim(sce, 'TSNE', colour_by = I(clusters$clusters[, 'k.5_cluster.fun.louvain'])) + ggtitle('k = 5'),
> > scater::plotReducedDim(sce, 'TSNE', colour_by = I(clusters$clusters[, 'k.15_cluster.fun.louvain'])) + ggtitle('k = 15'),
> > scater::plotReducedDim(sce, 'TSNE', colour_by = I(clusters$clusters[, 'k.25_cluster.fun.louvain'])) + ggtitle('k = 25'),
> > scater::plotReducedDim(sce, 'TSNE', colour_by = I(clusters$clusters[, 'k.50_cluster.fun.louvain'])) + ggtitle('k = 50')
> > ),
> > nrow = 2,
> > rel_heights = c(0.3, 0.7)
> > )
> > p
> > ```
> >
> > 
> >
> > ``` r
> > table(clusters$clusters[, 'k.5_cluster.fun.louvain'])
> > ##
> > ## 1 2 3 4 5 6 7 8 9 10 11 12 13 14 15 16 17 18
> > ## 543 359 571 37 130 377 22 360 493 216 192 116 253 92 359 164 17 39
> > ```
## 9.3 Cell annotation
### 9.3.1 Find marker genes
To interpret clustering results, one needs to identify the genes that drive separation between clusters. These marker genes allow to assign biological meaning to each cluster based on their functional annotation. In the most obvious case, the marker genes for each cluster are *a priori* associated with particular cell types, allowing us to treat the clustering as a *proxy* for cell type identity.
A general strategy is to compare each cluster to each of the other clusters, gene by gene, and then to combine the results of all these pairwise comparisons into a single ranking of marker genes for each cluster.
Rather than p-values (which are not really meaningful here: the clusters were defined from the very same data!), [`scrapper::scoreMarkers.se()`](https://rdrr.io/pkg/scrapper/man/scoreMarkers.se.html) computes several *effect sizes* for each pairwise comparison:
- `cohens.d`: the difference in mean log-expression, divided by the standard deviation;
- `auc`: the probability that a random cell from the cluster has a higher expression than a random cell from the other cluster;
- `delta.mean`: the difference in mean log-expression (i.e. a log-fold change);
- `delta.detected`: the difference in the proportion of cells in which the gene is detected.
For each gene and each cluster, these effect sizes are then summarized across all the pairwise comparisons (`min`, `mean`, `median`, `max`, `min.rank`).
``` r
markers <- scrapper::scoreMarkers.se(sce, groups = sce$clusters_graph)
names(markers)
## [1] "1" "2" "3" "4" "5" "6" "7" "8" "9" "10" "11" "12" "13" "14"
## [15] "15"
markers[[1]]
## DataFrame with 33694 rows and 22 columns
## mean detected cohens.d.min cohens.d.mean cohens.d.median
##
## LYZ 5.79881 0.998867 0.918981 6.56184 7.35930
## FTL 6.21842 1.000000 -0.225557 4.89812 5.42271
## TYROBP 4.03207 0.996602 0.484083 4.88980 6.26444
## S100A9 5.62039 0.994337 0.719917 4.39863 4.86862
## S100A8 5.35410 0.996602 0.656368 4.11869 4.58434
## ... ... ... ... ... ...
## RPSA 1.83750 0.860702 -2.71296 -1.84706 -2.03202
## RPL3 3.54900 0.993205 -3.51825 -1.85484 -2.03853
## RPL23A 3.38480 0.993205 -3.11481 -1.85500 -2.00169
## RPS27 4.95015 1.000000 -4.57761 -2.13122 -2.14967
## RPS29 3.83702 0.998867 -4.15567 -2.19747 -2.44224
## cohens.d.max cohens.d.min.rank auc.min auc.mean auc.median
##
## LYZ 9.43019 1 0.764021 0.973069 0.999024
## FTL 7.65334 1 0.458229 0.952104 0.999928
## TYROBP 7.69014 2 0.659840 0.951139 0.997527
## S100A9 5.55524 2 0.720098 0.969221 0.995018
## S100A8 5.14268 1 0.697331 0.969291 0.995238
## ... ... ... ... ... ...
## RPSA -0.5165340 33694 0.012923856 0.108047 0.0637134
## RPL3 -0.0621702 33694 0.001666397 0.129753 0.0656794
## RPL23A -0.2246136 33694 0.003730598 0.128103 0.0668927
## RPS27 0.3984984 33694 0.000619765 0.170162 0.0675333
## RPS29 -0.0913481 33694 0.000170498 0.117048 0.0377960
## auc.max auc.min.rank delta.mean.min delta.mean.mean
##
## LYZ 0.999171 2 0.585860 4.32330
## FTL 1.000000 1 -0.105343 2.60837
## TYROBP 0.997829 3 0.257390 2.77002
## S100A9 0.995650 2 0.731800 4.26926
## S100A8 0.996546 1 0.746458 4.26178
## ... ... ... ... ...
## RPSA 0.363280 33694 -2.02435 -1.438995
## RPL3 0.502406 33694 -1.80694 -1.029146
## RPL23A 0.452240 33694 -1.68962 -1.044715
## RPS27 0.635977 390 -1.75416 -0.877458
## RPS29 0.498543 33694 -2.00323 -1.125578
## delta.mean.median delta.mean.max delta.mean.min.rank
##
## LYZ 5.09884 5.32569 1
## FTL 2.92665 3.57447 4
## TYROBP 3.69374 3.76116 4
## S100A9 4.79115 4.98590 2
## S100A8 4.69164 4.88058 1
## ... ... ... ...
## RPSA -1.66918 -0.4609780 33694
## RPL3 -1.20442 -0.0374089 33694
## RPL23A -1.19250 -0.1509225 33694
## RPS27 -1.01944 0.2310889 33694
## RPS29 -1.32185 -0.0583310 33694
## delta.detected.min delta.detected.mean delta.detected.median
##
## LYZ -0.00113250 0.3433220 0.457941
## FTL 0.00000000 0.0043775 0.000000
## TYROBP -0.00339751 0.4524122 0.646381
## S100A9 -0.00566251 0.2736669 0.373358
## S100A8 -0.00339751 0.3602137 0.481501
## ... ... ... ...
## RPSA -0.13929785 -0.133338413 -0.13479005
## RPL3 -0.00679502 -0.006795017 -0.00679502
## RPL23A -0.00679502 -0.006605551 -0.00679502
## RPS27 0.00000000 0.000189466 0.00000000
## RPS29 -0.00113250 -0.000975861 -0.00113250
## delta.detected.max delta.detected.min.rank
##
## LYZ 0.5980738 34
## FTL 0.0198413 33694
## TYROBP 0.7704120 12
## S100A9 0.5099625 61
## S100A8 0.5955608 35
## ... ... ...
## RPSA -0.09763118 33694
## RPL3 -0.00679502 33694
## RPL23A -0.00414250 33694
## RPS27 0.00265252 33694
## RPS29 0.00106048 33694
```
> **NOTE:**
>
> Find the top markers of each cluster, ranking genes by their mean AUC across all pairwise comparisons. Check [`?scrapper::scoreMarkers.se`](https://rdrr.io/pkg/scrapper/man/scoreMarkers.se.html) and [`?scrapper::previewMarkers`](https://rdrr.io/pkg/scrapper/man/scoreMarkers.se.html) to find the right options to use.
>
> > **NOTE:**
> >
> > ``` r
> > scrapper::previewMarkers(markers[[1]], order.by = 'auc.mean')
> > ## DataFrame with 10 rows and 4 columns
> > ## mean detected lfc auc.mean
> > ##
> > ## LYZ 5.79881 0.998867 4.32330 0.973069
> > ## S100A8 5.35410 0.996602 4.26178 0.969291
> > ## S100A9 5.62039 0.994337 4.26926 0.969221
> > ## FTL 6.21842 1.000000 2.60837 0.952104
> > ## TYROBP 4.03207 0.996602 2.77002 0.951139
> > ## CTSS 3.79268 0.997735 2.56415 0.948547
> > ## RP11-1143G9.4 2.89853 0.977350 2.50622 0.948394
> > ## S100A6 4.46800 0.998867 2.28024 0.945661
> > ## FCN1 2.73346 0.960362 2.29155 0.939723
> > ## CSTA 2.31479 0.947905 1.95050 0.930436
> > top_markers <- lapply(markers, function(df) {
> > df <- df[order(df$auc.mean, decreasing = TRUE), ]
> > rownames(df)[1:5]
> > })
> > top_markers
> > ## $`1`
> > ## [1] "LYZ" "S100A8" "S100A9" "FTL" "TYROBP"
> > ##
> > ## $`2`
> > ## [1] "IL32" "TRAC" "JUNB" "CD3D" "LTB"
> > ##
> > ## $`3`
> > ## [1] "RPL21" "RPL34" "RPS14" "RPL32" "RPS15A"
> > ##
> > ## $`4`
> > ## [1] "LILRA4" "IRF7" "JCHAIN" "PLD4" "ITM2C"
> > ##
> > ## $`5`
> > ## [1] "HLA-DQA1" "CST3" "HLA-DPB1" "HLA-DRB1" "HLA-DRA"
> > ##
> > ## $`6`
> > ## [1] "IGKC" "CD79A" "CD79B" "MS4A1" "CD37"
> > ##
> > ## $`7`
> > ## [1] "CCL5" "IL32" "NKG7" "HLA-B" "CST7"
> > ##
> > ## $`8`
> > ## [1] "CD79A" "CD79B" "CD37" "CD74" "MS4A1"
> > ##
> > ## $`9`
> > ## [1] "NKG7" "GNLY" "CTSW" "KLRF1" "HOPX"
> > ##
> > ## $`10`
> > ## [1] "LST1" "AIF1" "SAT1" "COTL1" "FTH1"
> > ##
> > ## $`11`
> > ## [1] "IL32" "IL7R" "TRAC" "B2M" "LTB"
> > ##
> > ## $`12`
> > ## [1] "RPS14" "RPL21" "RPL32" "RPS27" "RPS6"
> > ##
> > ## $`13`
> > ## [1] "STMN1" "RP11-620J15.3" "GLUL" "TSC22D1"
> > ## [5] "SOX4"
> > ##
> > ## $`14`
> > ## [1] "CD79A" "CD79B" "IGHM" "MS4A1" "IGHD"
> > ##
> > ## $`15`
> > ## [1] "S100A8" "S100A9" "RP11-1143G9.4" "S100A12"
> > ## [5] "VCAN"
> > ```
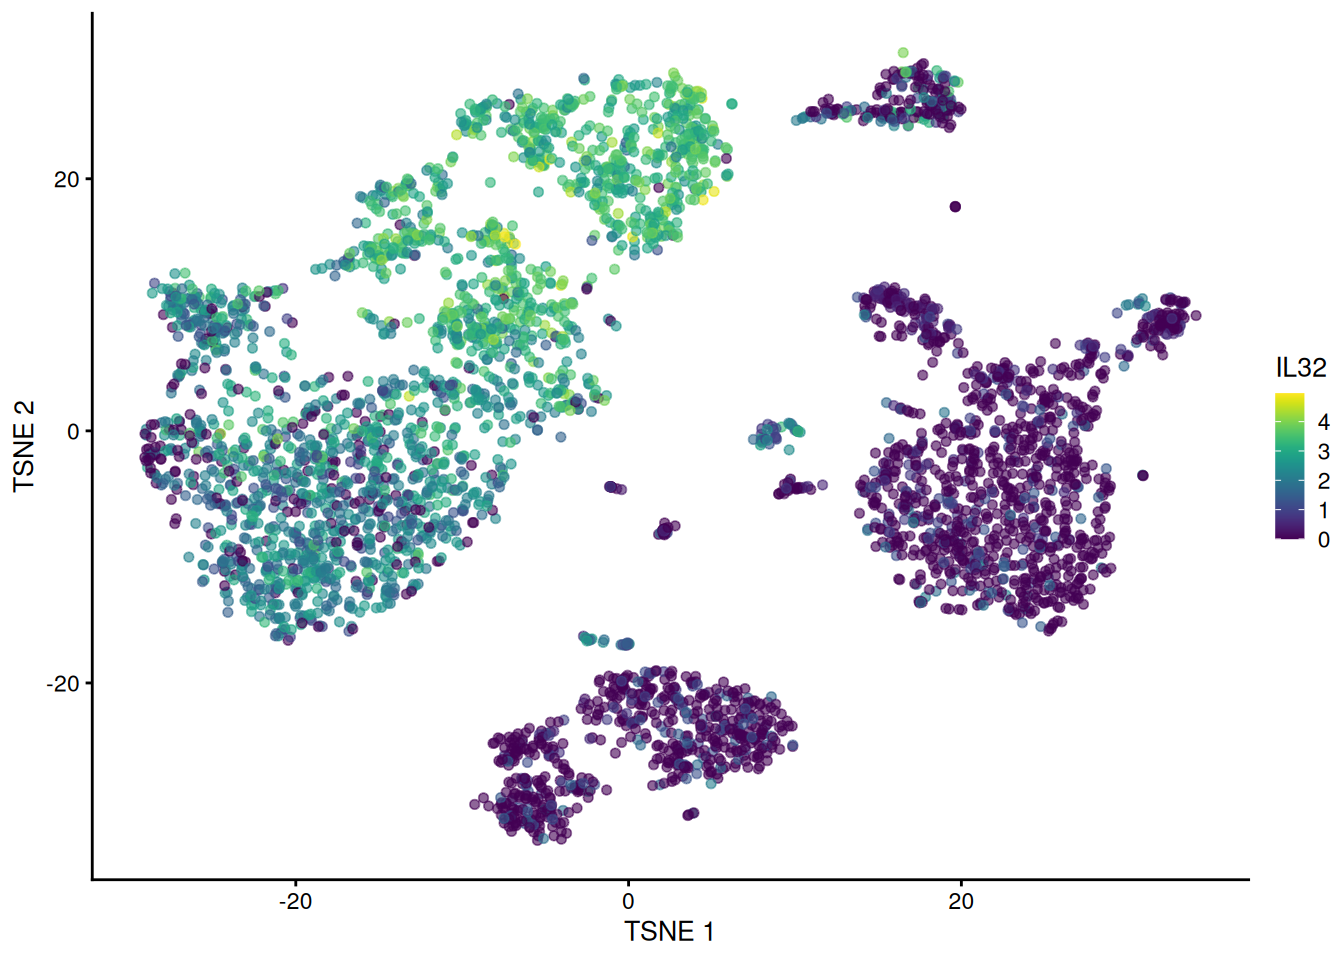
> **NOTE:**
>
> Plot the expression of the first marker of the second cluster in tSNE.
>
> > **NOTE:**
> >
> > ``` r
> > p <- scater::plotReducedDim(sce, 'TSNE', colour_by = top_markers[[2]][[1]])
> > p
> > ```
> >
> > 
### 9.3.2 Automated cell annotation
Many cell type reference databases are available over the Internet. Today, we will use a reference constructed from `Blueprint` and `ENCODE` data (`Martens and Stunnenberg 2013`; `The ENCODE Project Consortium 2012`). This reference is available from the `celldex` package as a `SummarizedExperiment` containing log-normalized gene expression for manually annotated samples.
``` r
celldex::surveyReferences()
## DataFrame with 7 rows and 10 columns
## name version path title
##
## 1 dice 2024-02-26 NA Human bulk RNA-seq d..
## 2 blueprint_encode 2024-02-26 NA Human bulk RNA-seq d..
## 3 immgen 2024-02-26 NA Mouse microarray exp..
## 4 mouse_rnaseq 2024-02-26 NA Bulk RNA-seq data of..
## 5 hpca 2024-02-26 NA Microarray data from..
## 6 novershtern_hematopo.. 2024-02-26 NA Bulk microarray expr..
## 7 monaco_immune 2024-02-26 NA Human bulk RNA-seq d..
## description taxonomy_id genome samples
##
## 1 Human bulk RNA-seq d.. 9606 1561
## 2 Human bulk RNA-seq d.. 9606 259
## 3 Mouse microarray exp.. 10090 830
## 4 Bulk RNA-seq data of.. 10090 MGSCv37 358
## 5 Microarray data from.. 9606 713
## 6 Bulk microarray expr.. 9606 211
## 7 Human bulk RNA-seq d.. 9606 GRCh38 114
## labels
##
## 1 label.main,label.fine,label.ont
## 2 label.main,label.fine,label.ont
## 3 label.main,label.fine,label.ont
## 4 label.main,label.fine,label.ont
## 5 label.main,label.fine,label.ont
## 6 label.main,label.fine,label.ont
## 7 label.main,label.fine,label.ont
## sources
##
## 1 PubMed:30449622:NA,ExperimentHub:EH3488:NA,ExperimentHub:EH3489:NA
## 2 PubMed:22955616:NA,PubMed:24091925:NA,PubMed:30643263:NA
## 3 PubMed:18800157:NA,GEO:GSE15907:NA,GEO:GSE37448:NA
## 4 PubMed:30858345:NA,URL:https://github.com/B..:NA,PubMed:30643263:NA
## 5 PubMed:24053356:NA,PubMed:30643263:NA,GitHub:dviraran/SingleR:adc4a0e4d5cfa79db18f..
## 6 PubMed:21241896:NA,GEO:GSE24759:NA,ExperimentHub:EH3490:NA
## 7 PubMed:30726743:NA,GEO:GSE107011:NA,ExperimentHub:EH3496:NA
ref <- celldex::fetchReference("blueprint_encode", "2024-02-26")
ref
## class: SummarizedExperiment
## dim: 19859 259
## metadata(0):
## assays(1): logcounts
## rownames(19859): TSPAN6 TNMD ... LINC00550 GIMAP1-GIMAP5
## rowData names(0):
## colnames(259): mature.neutrophil
## CD14.positive..CD16.negative.classical.monocyte ...
## epithelial.cell.of.umbilical.artery.1
## dermis.lymphatic.vessel.endothelial.cell.1
## colData names(3): label.main label.fine label.ont
prediction_types <- SingleR::SingleR(
test = sce,
ref = ref,
labels = ref$label.main
)
## using unknown matrix fallback for 'HDF5ArraySeed'
## using unknown matrix fallback for 'HDF5ArraySeed'
## using unknown matrix fallback for 'HDF5ArraySeed'
sce$annotation <- prediction_types$labels
table(sce$annotation)
##
## B-cells CD4+ T-cells CD8+ T-cells DC HSC
## 616 883 1388 1 14
## Monocytes NK cells
## 1201 237
table(sce$annotation, sce$clusters_graph)
##
## 1 2 3 4 5 6 7 8 9 10 11 12 13 14 15
## B-cells 0 1 0 14 0 377 0 216 0 0 0 0 0 8 0
## CD4+ T-cells 0 212 470 0 0 0 0 0 0 0 73 127 0 0 1
## CD8+ T-cells 0 243 440 0 0 0 481 0 5 0 85 125 1 8 0
## DC 0 0 0 0 1 0 0 0 0 0 0 0 0 0 0
## HSC 0 0 0 5 0 0 0 0 0 0 0 0 9 0 0
## Monocytes 883 0 0 18 129 0 0 0 0 133 0 0 0 0 38
## NK cells 0 0 0 0 0 0 49 0 187 0 0 0 0 1 0
```
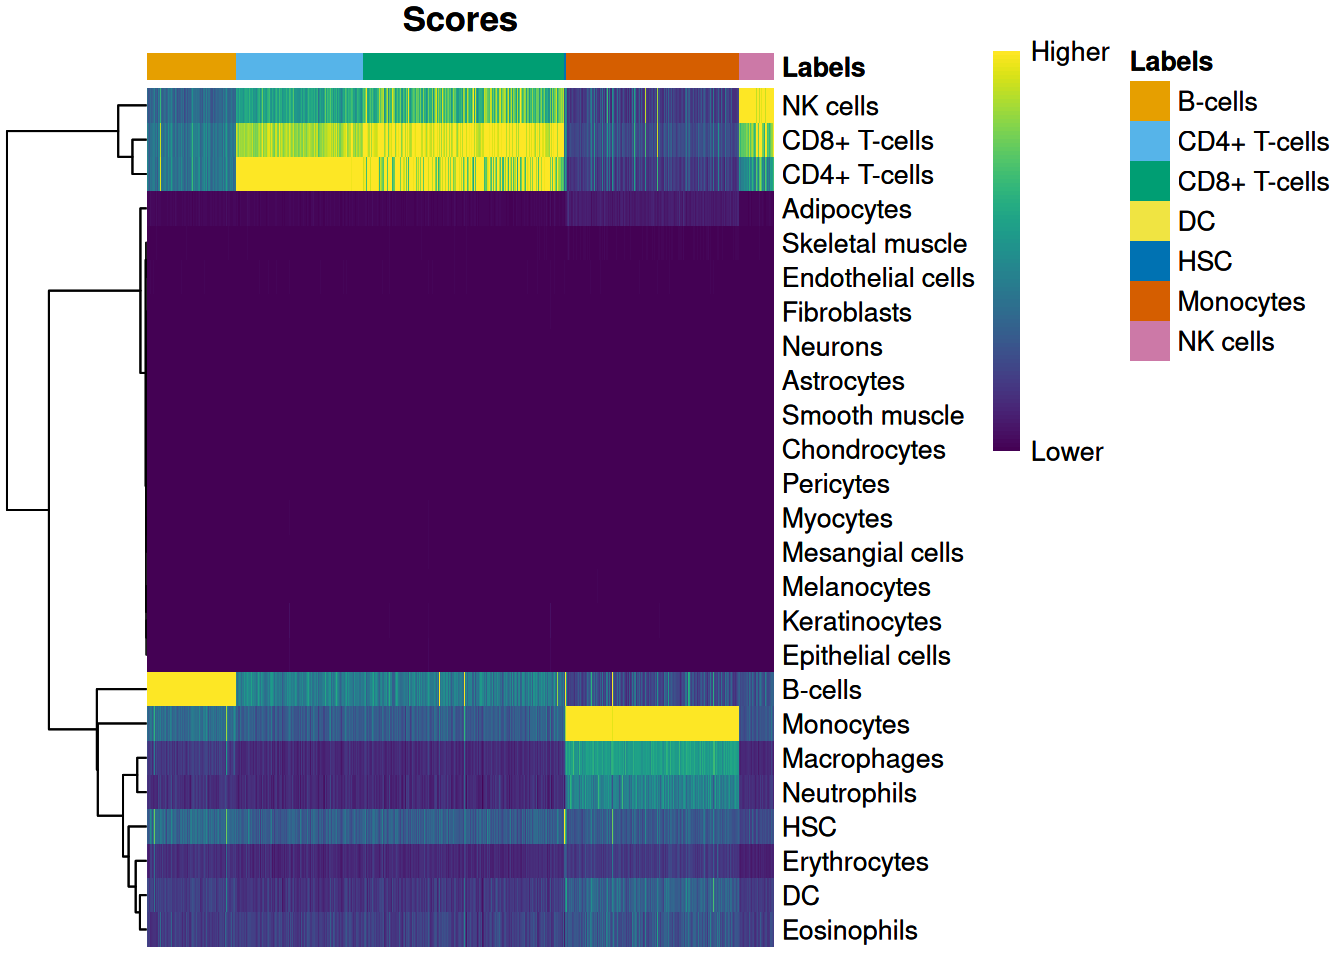
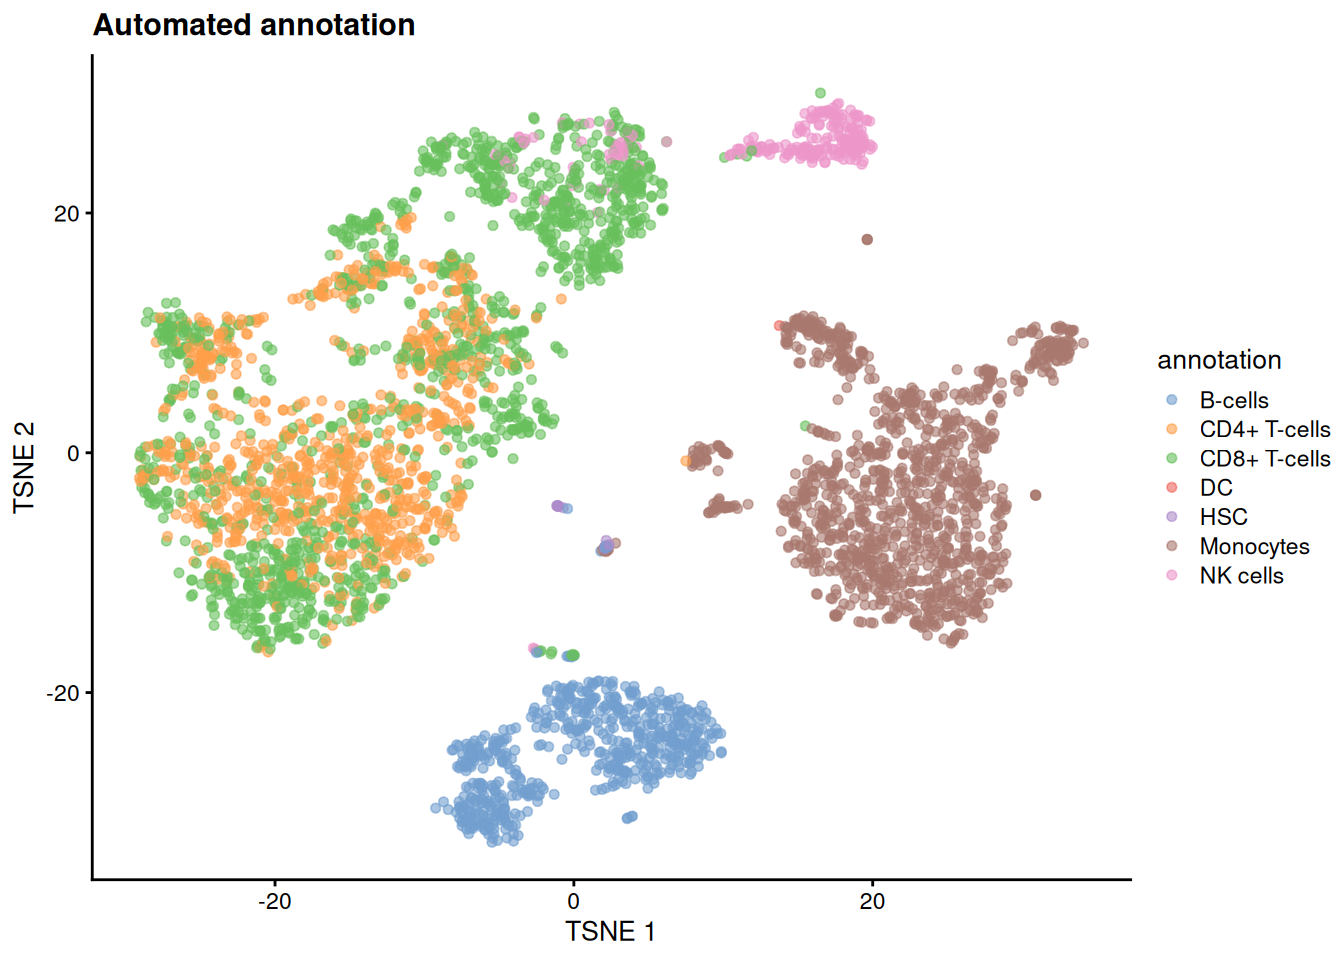
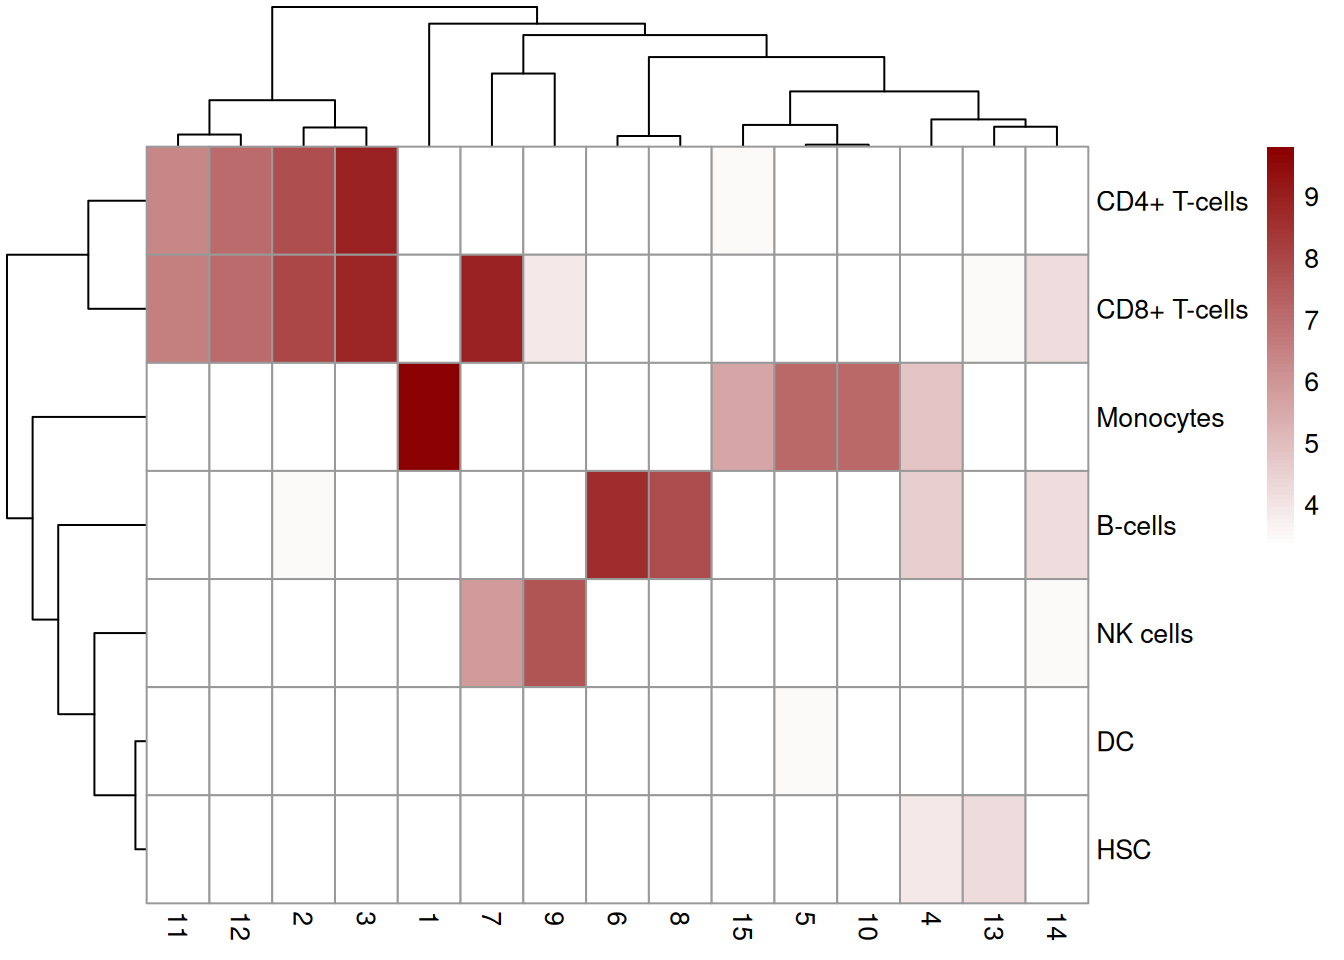
> **NOTE:**
>
> Using `scater` and `SingleR` utilities, visually compare the annotation scores for cells in each cluster.
>
> Did the automated annotation work robuslty? How does it compare to our clustering? Is automated annotation as sensitive as graph-based clustering?
>
> > **NOTE:**
> >
> > ``` r
> > p <- SingleR::plotScoreHeatmap(prediction_types)
> > p
> > ```
> >
> > 
> >
> > ``` r
> > p <- scater::plotReducedDim(sce, 'TSNE', colour_by = 'annotation') + ggtitle('Automated annotation')
> > p
> > ```
> >
> > 
> >
> > ``` r
> > p <- pheatmap::pheatmap(
> > log2(table(Annotation = sce$annotation, Cluster = sce$clusters_graph)+10),
> > color = colorRampPalette(c("white", "darkred"))(101)
> > )
> > ```
> >
> > 
## 9.4 Bonus
Try to re-run the full analysis (normalization, feature selection, PCA, clustering, annotation) on another PBMC dataset provided by `TENxPBMCData` (e.g. `pbmc3k` or `pbmc8k`), in a single script. Do you recover the same populations? If you prefer using `Seurat`, don’t hesitate to do the same with the `Seurat` workflow!
## 9.5 Acknowledgements
This exercise was adapted from Chapts. 7-12 of [Orchestrating Single-Cell Analysis with Bioconductor](https://bioconductor.org/books/release/OSCA/).
## 9.6 Session info
> **NOTE:**
>
> ## ─ Session info ────────────────────────────────────────────────────────────
> ## setting value
> ## version R version 4.6.1 (2026-06-24)
> ## os Ubuntu 24.04.5 LTS
> ## system x86_64, linux-gnu
> ## ui X11
> ## language (EN)
> ## collate C
> ## ctype en_US.UTF-8
> ## tz Etc/UTC
> ## date 2026-11-13
> ## pandoc 3.13 @ /usr/bin/ (via rmarkdown)
> ## quarto 1.11.5 @ /usr/local/bin/quarto
> ##
> ## ─ Packages ────────────────────────────────────────────────────────────────
> ## package * version date (UTC) lib source
> ## abind * 1.4-8 2024-09-12 [2] RSPM (R 4.6.0)
> ## alabaster.base 1.13.5 2026-11-04 [2] Bioconductor 3.24 (R 4.6.1)
> ## alabaster.matrix 1.13.4 2026-09-23 [2] Bioconductor 3.24 (R 4.6.1)
> ## alabaster.ranges 1.13.1 2026-09-06 [2] Bioconductor 3.24 (R 4.6.1)
> ## alabaster.schemas 1.13.0 2026-04-28 [2] Bioconductor 3.24 (R 4.6.1)
> ## alabaster.se 1.13.1 2026-09-06 [2] Bioconductor 3.24 (R 4.6.1)
> ## AnnotationDbi 1.75.2 2026-07-21 [2] Bioconductor 3.24 (R 4.6.1)
> ## AnnotationHub 4.3.3 2026-10-23 [2] Bioconductor 3.24 (R 4.6.1)
> ## backports 1.5.1 2026-04-03 [2] RSPM (R 4.6.0)
> ## beachmat 2.29.3 2026-09-23 [2] Bioconductor 3.24 (R 4.6.1)
> ## beeswarm 0.4.0 2021-06-01 [2] RSPM (R 4.6.0)
> ## Biobase * 2.73.2 2026-07-29 [2] Bioconductor 3.24 (R 4.6.1)
> ## BiocBaseUtils 1.15.1 2026-05-10 [2] Bioconductor 3.24 (R 4.6.1)
> ## BiocFileCache 3.3.3 2026-11-11 [2] Bioconductor 3.24 (R 4.6.1)
> ## BiocGenerics * 0.59.13 2026-11-11 [2] Bioconductor 3.24 (R 4.6.1)
> ## BiocManager 1.30.27 2025-11-14 [2] CRAN (R 4.6.1)
> ## BiocNeighbors 2.7.3 2026-08-21 [2] Bioconductor 3.24 (R 4.6.1)
> ## BiocParallel 1.47.0 2026-04-28 [2] Bioconductor 3.24 (R 4.6.1)
> ## BiocSingular 1.29.2 2026-10-08 [2] Bioconductor 3.24 (R 4.6.1)
> ## BiocVersion 3.24.0 2026-04-28 [2] Bioconductor 3.24 (R 4.6.1)
> ## Biostrings 2.81.9 2026-09-06 [2] Bioconductor 3.24 (R 4.6.1)
> ## bit 4.6.0 2025-03-06 [2] RSPM (R 4.6.0)
> ## bit64 4.8.6 2026-09-01 [2] RSPM (R 4.6.0)
> ## blob 1.3.0 2026-01-14 [2] RSPM (R 4.6.0)
> ## bluster 1.23.1 2026-08-25 [2] Bioconductor 3.24 (R 4.6.1)
> ## cachem 1.1.0 2024-05-16 [2] RSPM (R 4.6.0)
> ## celldex 1.23.0 2026-04-30 [2] Bioconductor 3.24 (R 4.6.1)
> ## checkmate 2.3.4 2026-02-03 [2] RSPM (R 4.6.0)
> ## cli 3.6.6 2026-04-09 [2] RSPM (R 4.6.0)
> ## cluster 2.1.8.3 2026-07-30 [2] RSPM (R 4.6.1)
> ## clustree 0.5.1 2023-11-05 [2] RSPM (R 4.6.0)
> ## codetools 0.2-20 2024-03-31 [3] CRAN (R 4.6.1)
> ## cowplot 1.2.0 2025-07-07 [2] RSPM (R 4.6.0)
> ## crayon 1.5.3 2024-06-20 [2] RSPM (R 4.6.0)
> ## curl 8.1.0 2026-10-14 [2] RSPM (R 4.6.0)
> ## DBI 1.3.0 2026-02-25 [2] RSPM (R 4.6.0)
> ## dbplyr 2.6.0 2026-06-17 [2] RSPM (R 4.6.0)
> ## DelayedArray * 0.39.8 2026-09-30 [2] Bioconductor 3.24 (R 4.6.1)
> ## DelayedMatrixStats 1.35.0 2026-04-28 [2] Bioconductor 3.24 (R 4.6.1)
> ## dichromat 2.0-1 2026-07-22 [2] RSPM (R 4.6.0)
> ## digest 0.6.39 2025-11-19 [2] RSPM (R 4.6.0)
> ## dplyr * 1.2.1 2026-04-03 [2] RSPM (R 4.6.0)
> ## dqrng 0.4.1 2024-05-28 [2] RSPM (R 4.6.0)
> ## edgeR 4.99.12 2026-11-04 [2] Bioconductor 3.24 (R 4.6.1)
> ## evaluate 1.0.5 2025-08-27 [2] RSPM (R 4.6.0)
> ## ExperimentHub 3.3.2 2026-08-12 [2] Bioconductor 3.24 (R 4.6.1)
> ## farver 2.1.2 2024-05-13 [2] RSPM (R 4.6.0)
> ## fastmap 1.2.0 2024-05-15 [2] RSPM (R 4.6.0)
> ## filelock 1.0.3 2023-12-11 [2] RSPM (R 4.6.0)
> ## forcats * 1.0.1 2025-09-25 [2] RSPM (R 4.6.0)
> ## generics * 0.1.4 2025-05-09 [2] RSPM (R 4.6.0)
> ## GenomicRanges * 1.65.4 2026-09-02 [2] Bioconductor 3.24 (R 4.6.1)
> ## ggbeeswarm 0.7.3 2025-11-29 [2] RSPM (R 4.6.0)
> ## ggforce 0.5.0 2025-06-18 [2] RSPM (R 4.6.0)
> ## ggplot2 * 4.0.3 2026-04-22 [2] RSPM (R 4.6.0)
> ## ggraph * 2.2.2 2025-08-24 [2] RSPM (R 4.6.0)
> ## ggrepel 0.9.8 2026-03-17 [2] RSPM (R 4.6.0)
> ## glue 1.8.1 2026-04-17 [2] RSPM (R 4.6.0)
> ## graphlayouts 1.2.5 2026-07-22 [2] RSPM (R 4.6.0)
> ## gridExtra 2.3.1 2026-06-25 [2] RSPM (R 4.6.0)
> ## gtable 0.3.6 2024-10-25 [2] RSPM (R 4.6.0)
> ## gypsum 1.9.0 2026-04-28 [2] Bioconductor 3.24 (R 4.6.1)
> ## h5mread * 1.5.3 2026-09-02 [2] Bioconductor 3.24 (R 4.6.1)
> ## HDF5Array * 1.41.3 2026-08-21 [2] Bioconductor 3.24 (R 4.6.1)
> ## hms 1.1.4 2025-10-17 [2] RSPM (R 4.6.0)
> ## htmltools 0.5.9 2025-12-04 [2] RSPM (R 4.6.0)
> ## htmlwidgets 1.6.4 2023-12-06 [2] RSPM (R 4.6.0)
> ## httr 1.4.9 2026-09-01 [2] RSPM (R 4.6.0)
> ## httr2 1.3.0 2026-07-13 [2] RSPM (R 4.6.0)
> ## igraph 2.3.4 2026-09-30 [2] RSPM (R 4.6.0)
> ## IRanges * 2.47.5 2026-08-27 [2] Bioconductor 3.24 (R 4.6.1)
> ## irlba 2.4.1 2026-10-05 [2] RSPM (R 4.6.0)
> ## jsonlite 2.0.0 2025-03-27 [2] RSPM (R 4.6.0)
> ## KEGGREST 1.53.6 2026-07-23 [2] Bioconductor 3.24 (R 4.6.1)
> ## knitr 1.52 2026-09-06 [2] RSPM (R 4.6.0)
> ## labeling 0.4.3 2023-08-29 [2] RSPM (R 4.6.0)
> ## lattice 0.23-1 2026-08-12 [2] RSPM (R 4.6.1)
> ## lifecycle 1.0.5 2026-01-08 [2] RSPM (R 4.6.0)
> ## limma 3.99.4 2026-11-04 [2] Bioconductor 3.24 (R 4.6.1)
> ## lubridate * 1.9.5 2026-02-04 [2] RSPM (R 4.6.0)
> ## magrittr 2.0.5 2026-04-04 [2] RSPM (R 4.6.0)
> ## MASS 7.3-66 2026-07-15 [2] RSPM (R 4.6.1)
> ## Matrix * 1.7-6 2026-07-25 [2] RSPM (R 4.6.1)
> ## MatrixGenerics * 1.25.0 2026-04-28 [2] Bioconductor 3.24 (R 4.6.1)
> ## matrixStats * 1.5.0 2025-01-07 [2] RSPM (R 4.6.0)
> ## memoise 2.0.1 2021-11-26 [2] RSPM (R 4.6.0)
> ## metapod 1.21.0 2026-04-28 [2] Bioconductor 3.24 (R 4.6.1)
> ## otel 0.2.0 2025-08-29 [2] RSPM (R 4.6.0)
> ## patchwork * 1.3.2 2025-08-25 [2] RSPM (R 4.6.0)
> ## pheatmap 1.0.13 2025-06-05 [2] RSPM (R 4.6.0)
> ## pillar 1.11.1 2025-09-17 [2] RSPM (R 4.6.0)
> ## pkgconfig 2.0.3 2019-09-22 [2] RSPM (R 4.6.0)
> ## png 0.1-9 2026-03-15 [2] RSPM (R 4.6.0)
> ## polyclip 1.10-7 2024-07-23 [2] RSPM (R 4.6.0)
> ## purrr * 1.2.2 2026-04-10 [2] RSPM (R 4.6.0)
> ## R6 2.6.1 2025-02-15 [2] RSPM (R 4.6.0)
> ## rappdirs 0.3.4 2026-01-17 [2] RSPM (R 4.6.0)
> ## RColorBrewer 1.1-3 2022-04-03 [2] RSPM (R 4.6.0)
> ## Rcpp 1.1.2 2026-07-05 [2] RSPM (R 4.6.0)
> ## RcppAnnoy 0.0.23 2026-01-12 [2] RSPM (R 4.6.0)
> ## readr * 2.2.0 2026-02-19 [2] RSPM (R 4.6.0)
> ## rhdf5 * 2.57.20 2026-10-06 [2] Bioconductor 3.24 (R 4.6.1)
> ## rhdf5filters 1.25.5 2026-10-28 [2] Bioconductor 3.24 (R 4.6.1)
> ## Rhdf5lib 2.1.0 2026-04-28 [2] Bioconductor 3.24 (R 4.6.1)
> ## rlang 1.3.0 2026-07-05 [2] RSPM (R 4.6.0)
> ## rmarkdown 2.32 2026-09-01 [2] RSPM (R 4.6.0)
> ## RSpectra 0.16-2 2024-07-18 [2] RSPM (R 4.6.0)
> ## RSQLite 3.53.3 2026-06-30 [2] RSPM (R 4.6.0)
> ## rsvd 1.0.6 2026-10-17 [2] RSPM (R 4.6.0)
> ## Rtsne 0.17 2023-12-07 [2] RSPM (R 4.6.0)
> ## S4Arrays * 1.13.2 2026-09-30 [2] Bioconductor 3.24 (R 4.6.1)
> ## S4Vectors * 0.51.10 2026-09-16 [2] Bioconductor 3.24 (R 4.6.1)
> ## S7 0.2.2 2026-04-22 [2] RSPM (R 4.6.0)
> ## ScaledMatrix 1.21.0 2026-04-28 [2] Bioconductor 3.24 (R 4.6.1)
> ## scales 1.4.0 2025-04-24 [2] RSPM (R 4.6.0)
> ## scater 1.41.3 2026-10-25 [2] Bioconductor 3.24 (R 4.6.1)
> ## scran 1.41.1 2026-05-20 [2] Bioconductor 3.24 (R 4.6.1)
> ## scrapper 1.7.11 2026-11-04 [2] Bioconductor 3.24 (R 4.6.1)
> ## scuttle 1.23.2 2026-08-27 [2] Bioconductor 3.24 (R 4.6.1)
> ## Seqinfo * 1.3.2 2026-08-27 [2] Bioconductor 3.24 (R 4.6.1)
> ## sessioninfo 1.2.4 2026-06-04 [2] RSPM (R 4.6.0)
> ## SingleCellExperiment * 1.35.2 2026-07-16 [2] Bioconductor 3.24 (R 4.6.1)
> ## SingleR 2.15.4 2026-09-10 [2] Bioconductor 3.24 (R 4.6.1)
> ## SparseArray * 1.13.4 2026-09-30 [2] Bioconductor 3.24 (R 4.6.1)
> ## sparseMatrixStats 1.25.0 2026-04-28 [2] Bioconductor 3.24 (R 4.6.1)
> ## statmod 1.5.2 2026-05-17 [2] RSPM (R 4.6.0)
> ## stringi 1.8.9 2026-08-04 [2] RSPM (R 4.6.0)
> ## stringr * 1.6.0 2025-11-04 [2] RSPM (R 4.6.0)
> ## SummarizedExperiment * 1.43.0 2026-04-28 [2] Bioconductor 3.24 (R 4.6.1)
> ## TENxPBMCData * 1.31.0 2026-04-30 [2] Bioconductor 3.24 (R 4.6.1)
> ## tibble * 3.3.1 2026-01-11 [2] RSPM (R 4.6.0)
> ## tidygraph 1.3.1 2024-01-30 [2] RSPM (R 4.6.0)
> ## tidyr * 1.3.2 2025-12-19 [2] RSPM (R 4.6.0)
> ## tidyselect 1.2.1 2024-03-11 [2] RSPM (R 4.6.0)
> ## tidyverse * 2.0.0 2023-02-22 [2] RSPM (R 4.6.0)
> ## timechange 0.4.0 2026-01-29 [2] RSPM (R 4.6.0)
> ## tweenr 2.0.3 2024-02-26 [2] RSPM (R 4.6.0)
> ## tzdb 0.5.0 2025-03-15 [2] RSPM (R 4.6.0)
> ## uwot 0.2.5 2026-08-29 [2] RSPM (R 4.6.0)
> ## vctrs 0.7.3 2026-04-11 [2] RSPM (R 4.6.0)
> ## vipor 0.4.7 2023-12-18 [2] RSPM (R 4.6.0)
> ## viridis 0.6.5 2024-01-29 [2] RSPM (R 4.6.0)
> ## viridisLite 0.4.3 2026-02-04 [2] RSPM (R 4.6.0)
> ## withr 3.0.3 2026-06-19 [2] RSPM (R 4.6.0)
> ## xfun 0.62 2026-10-16 [2] RSPM (R 4.6.0)
> ## XVector 0.53.0 2026-04-28 [2] Bioconductor 3.24 (R 4.6.1)
> ## yaml 2.3.12 2025-12-10 [2] RSPM (R 4.6.0)
> ##
> ## [1] /tmp/RtmpyQdi1U/Rinstc2e9543f3
> ## [2] /usr/local/lib/R/site-library
> ## [3] /usr/local/lib/R/library
> ## * ── Packages attached to the search path.
> ##
> ## ───────────────────────────────────────────────────────────────────────────