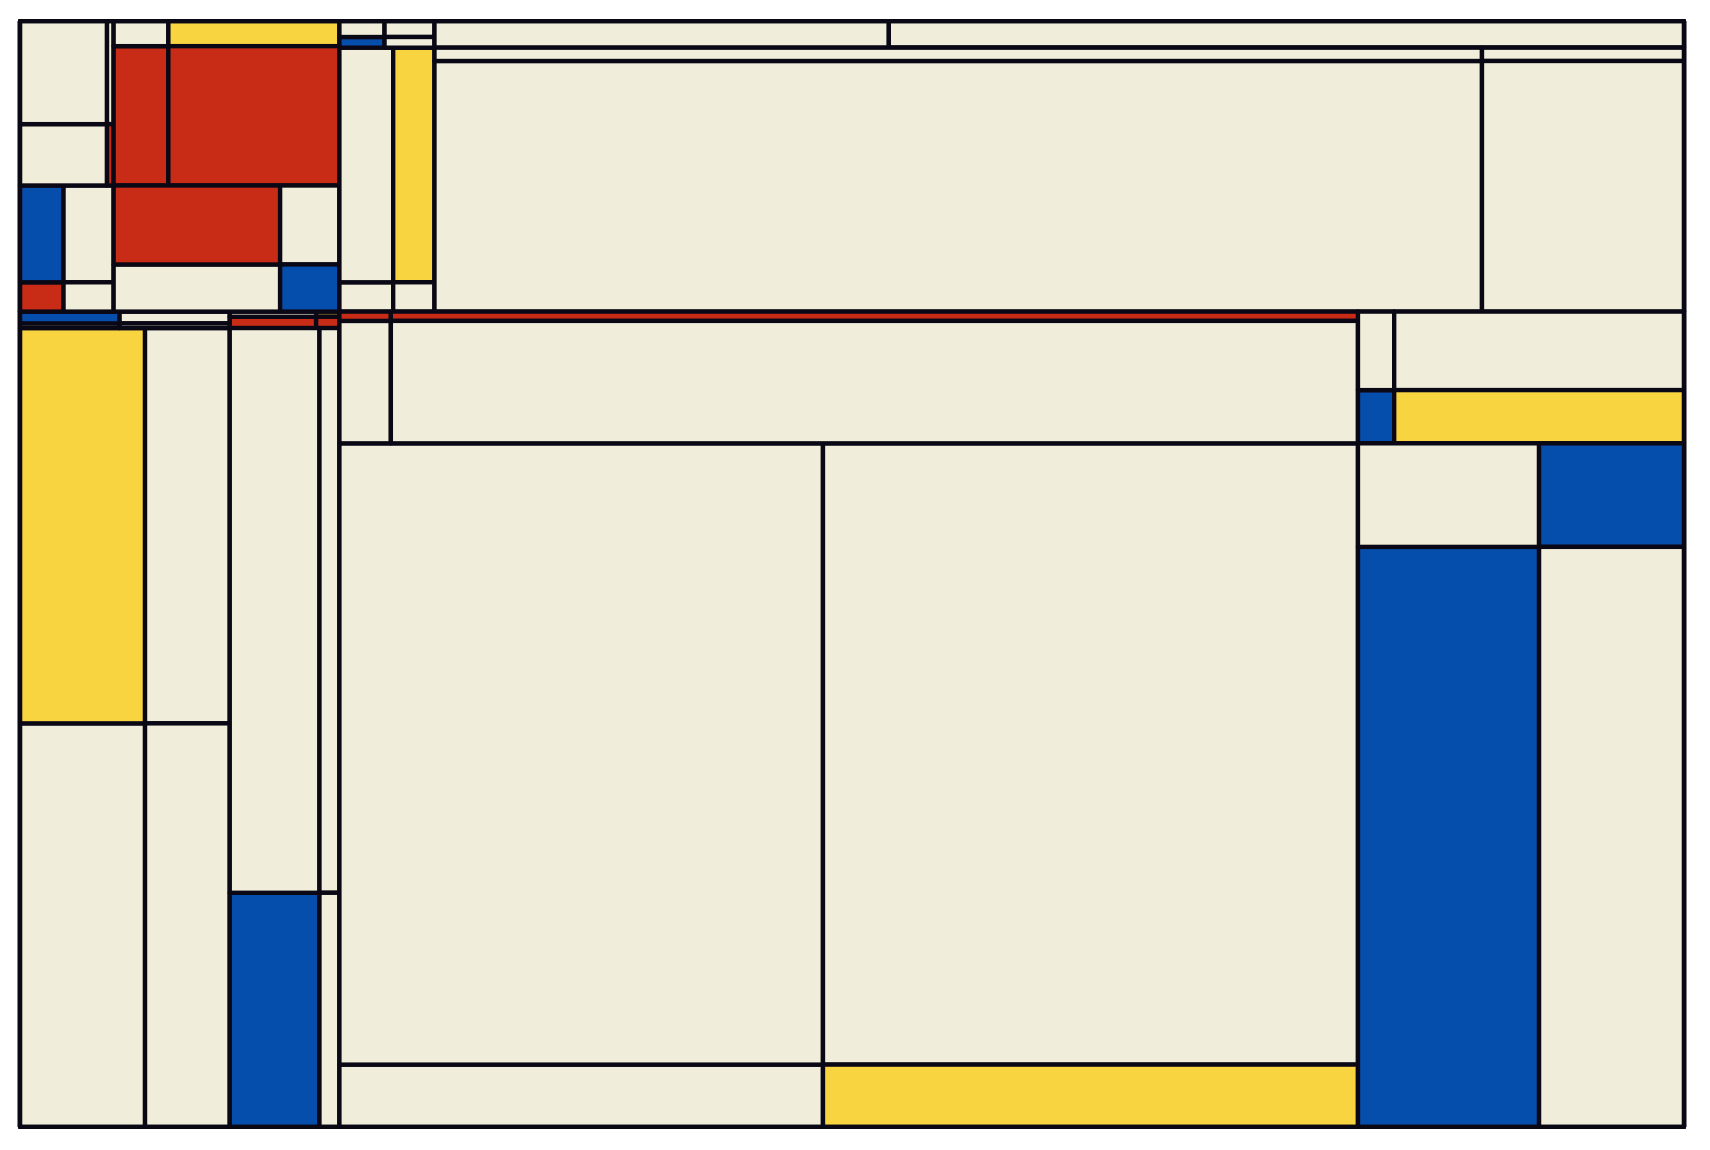
Art customization
The ratio of the plot is controlled by the ratio argument (1 by default, i.e. a square plot).
How “deep” the plot is (i.e. how recursive the internal loop is) is controlled by the levels argument (4 by default).
By default, some tiles are randomly split in 2 (either vertically or horizontally), rather than in 4. This is controlled by the filter argument (TRUE by default).
One can also control the minimum stretch (both horizontally and vertically) of each tile. By default, this ensures that the tiles are somewhat consistent. This can be reduced/increased with the min.stretch argument (0.04, or 4% by default)
This option can also be deactivated by using min.stretch = 0. This leads to a large increase of tiles, since they are all considered valid !
Many plots at once
lapply(1:50, function(seed) {
    message(seed)
    set.seed(seed)
    ratio <- sample(seq(0.5, 1.5, by = 0.1), 1)
    level <- sample(2:8, 1)
    filter <- sample(c(TRUE, FALSE))[1]
    whites <- sample(seq(0.2, 0.8, by = 0.1), 1)
    stretch <- sample(seq(0.02, 0.10, 0.001))[1]
    p <- tileSet(
        ratio = ratio,
        levels = level,
        seed = seed,
        filter = filter,
        min.stretch = stretch
    ) %>% plotTiles(white.density = whites)
    ggplot2::ggsave(glue::glue('mondrian_seed-{seed}.png'), w = 10, h = 10*ratio)
})